Analysis Insights
A diagnostic view of failure messages over time. It shows which error types are rising, which tests they hit, and which branches are most affected.
Use it to pick the next fix with data. You can see the biggest error pattern, the tests it breaks, and the branches it slows down.
Error Message Over Time
-
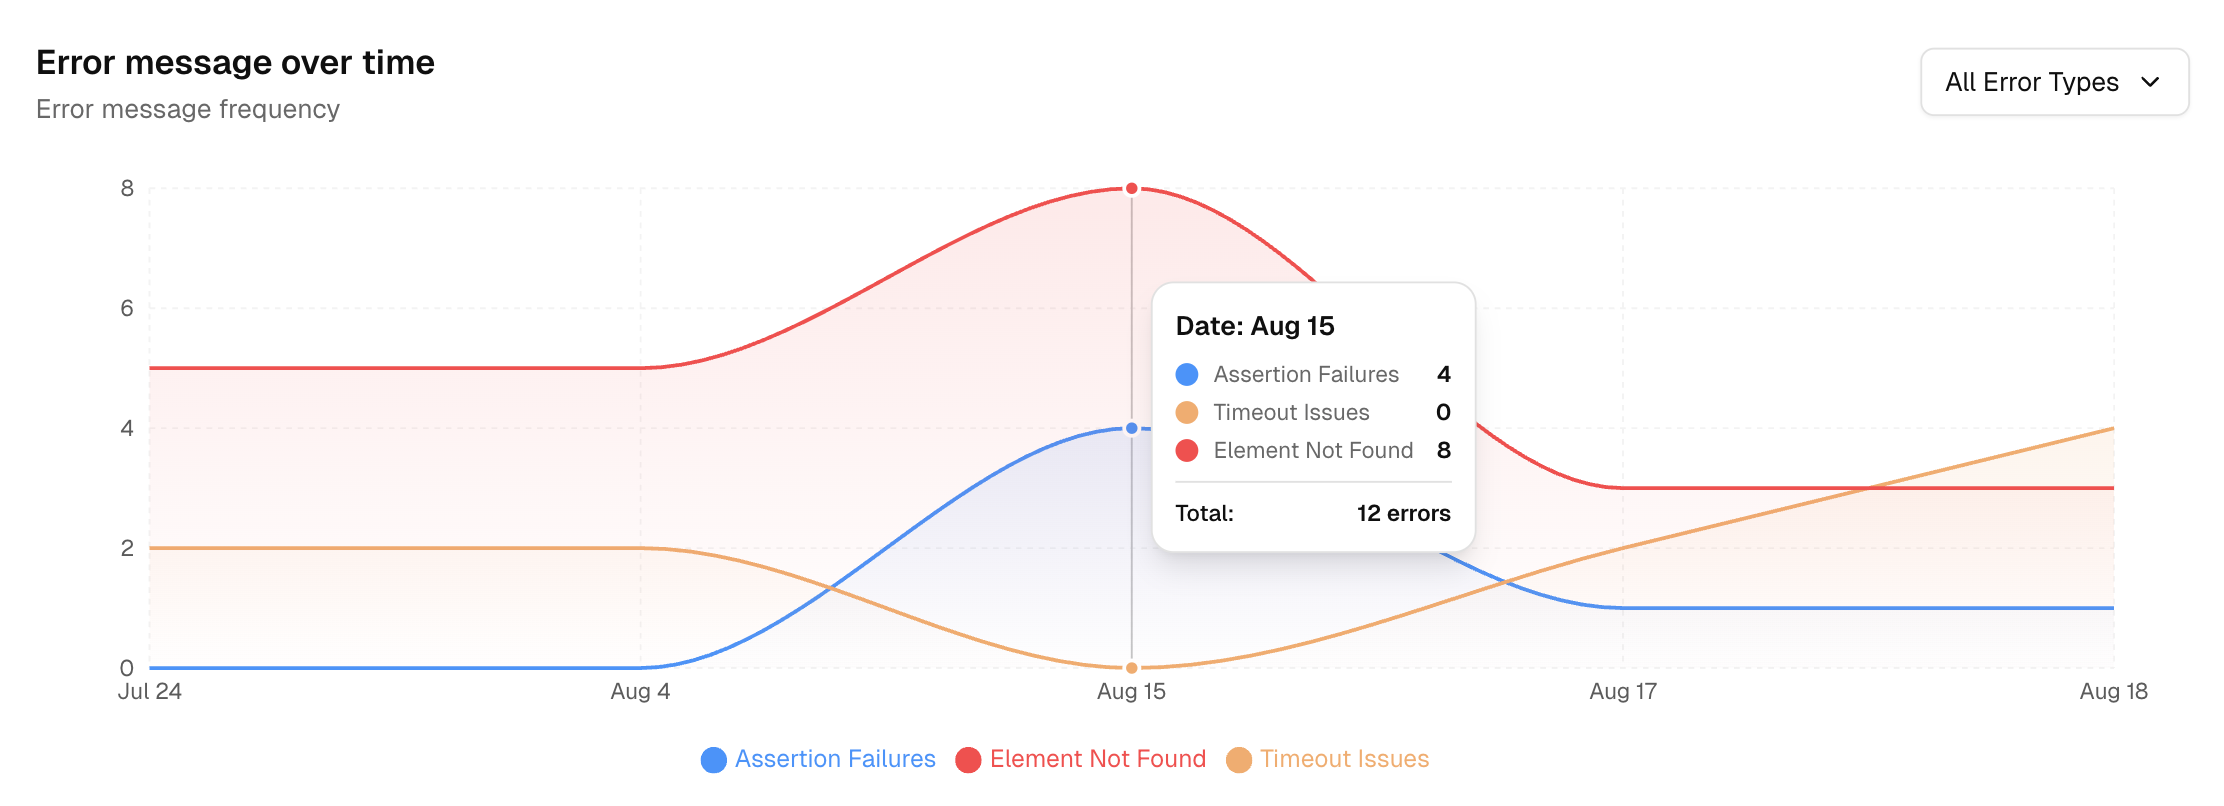
See how many times each error type happens each day. Hover over the graph for exact numbers.
-
Use the controls to highlight one error type (like Assertion Failures or Timeout Issues) and easily spot when problems spike or first appear.
-
Spikes often align with code, data, or environment changes. Use this to answer “when did this start?” and “is it getting better?”.
Error Categories
-
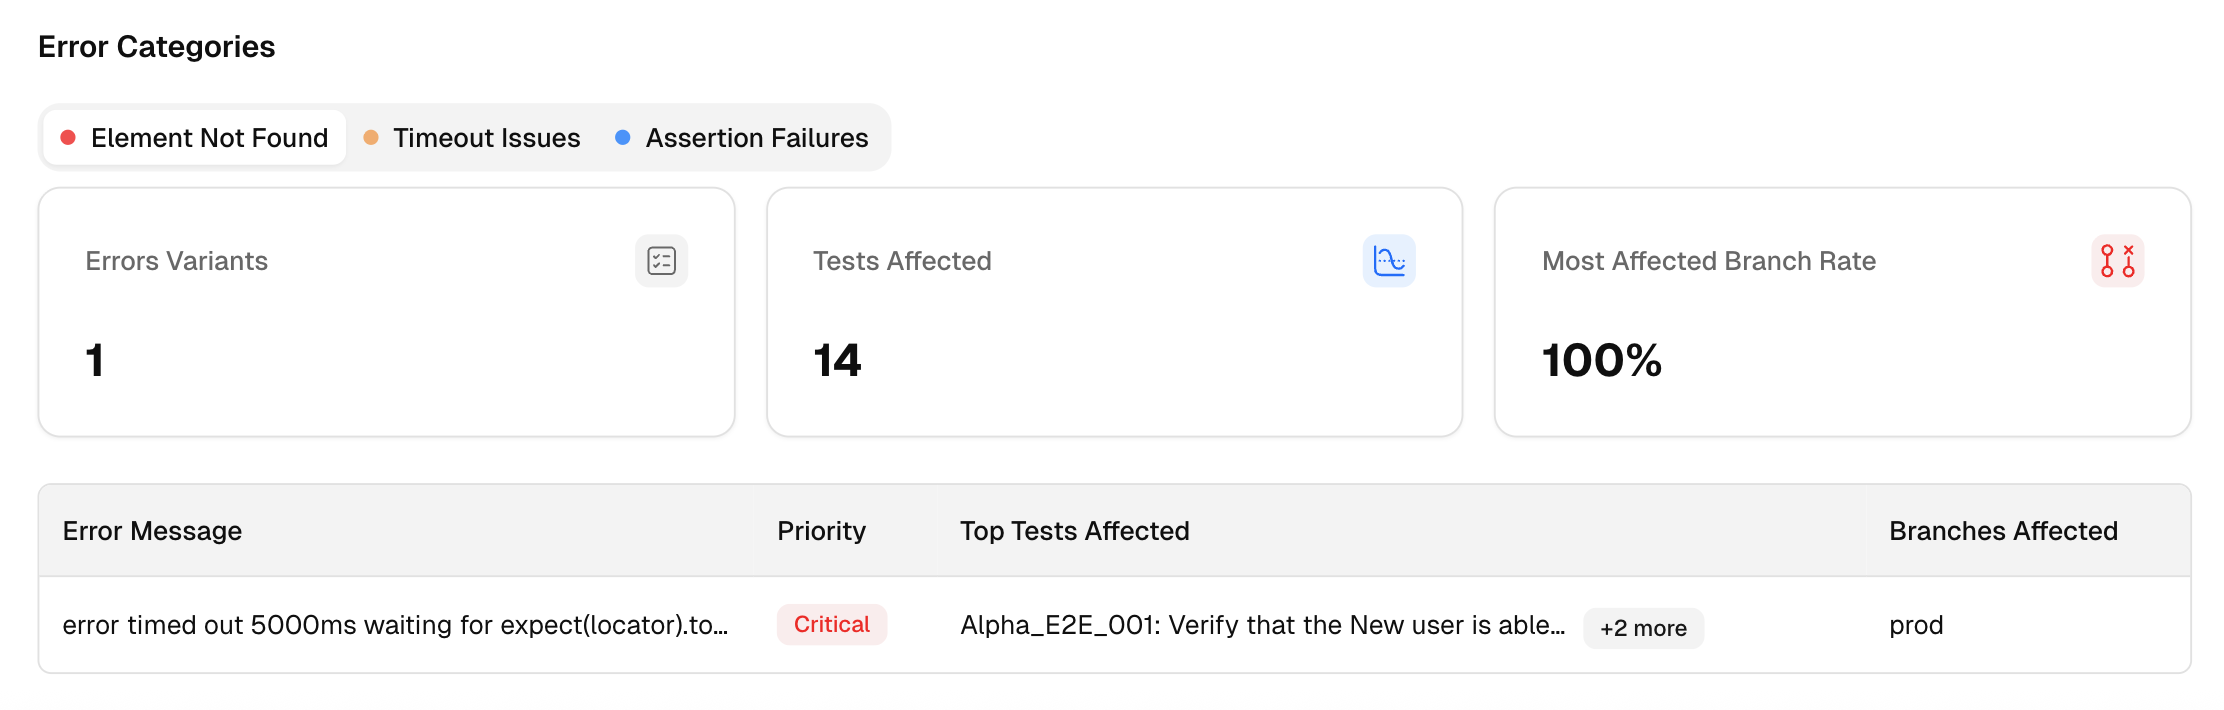
Errors Variants: number of unique error messages (similar errors are grouped) under the base error category. Helps you see how many distinct errors you have.
-
Tests Affected: count of unique tests hit by the error type. Higher counts mean wider impact.
-
Most Affected Branch Rate: the most affected branch rate for the error category. Shows if errors are spread into multiple branches or are coming from just one branch.
-
Error list: A table that ties each error message to its impact:
-
Error Message: the normalized message (e.g., element not found, assertion failed).
-
Priority: severity tag to guide attention (Critical/Medium/Low).
-
Top Tests Affected: shows the top 3 test(s) that fall under this error variant. Helps in finding the test causing the error variant.
-
Branches Affected: all branches where this error variant appeared. Hover to see the branches.
Start with the Critical rows that hit many tests or a key branch.