Errors
The Errors tab gives you a clear view of what's breaking your tests and why. It groups error messages by type, tracks how often they occur, and shows which tests they affect.
Use this tab to spot patterns, find recurring problems, and decide what to fix first.
For QA Engineers: Quickly identify whether failures come from flaky selectors, unstable network calls, or actual product bugs.
For Developers: Pinpoint which components, endpoints, or test files keep failing so you can address the root cause.
At the top of the page, three filters control what data you see:
- Time Period: Last 7, 14, or 30 days.
- Environment: Filter by your mapped environments.
- Error Types: Show all error types or focus on a specific category.
Error Type Reference
| Category | What It Means | Common Causes |
|---|---|---|
| Assertion Failures | Expected values didn't match actual values. | Logic bugs, changed UI text, outdated test data. |
| Timeout Issues | An action or wait exceeded the allowed time. | Slow API responses, overloaded CI runners, missing elements. |
| Element Not Found | A locator didn't resolve to any element on the page. | Changed selectors, removed UI components, timing issues. |
| Network Issues | HTTP requests failed or returned unexpected responses. | Flaky endpoints, rate limits, service outages. |
| JavaScript Errors | Runtime errors in browser console or test code. | Uncaught exceptions, missing dependencies, broken scripts. |
| Browser Issues | Problems with browser launch, context, or rendering. | Driver version mismatches, resource limits, CI configuration. |
| Other Failures | Errors that don't fit the above categories. | Setup failures, file system issues, environment misconfiguration. |
Metrics
Three tiles summarize the error landscape for your selected filters.
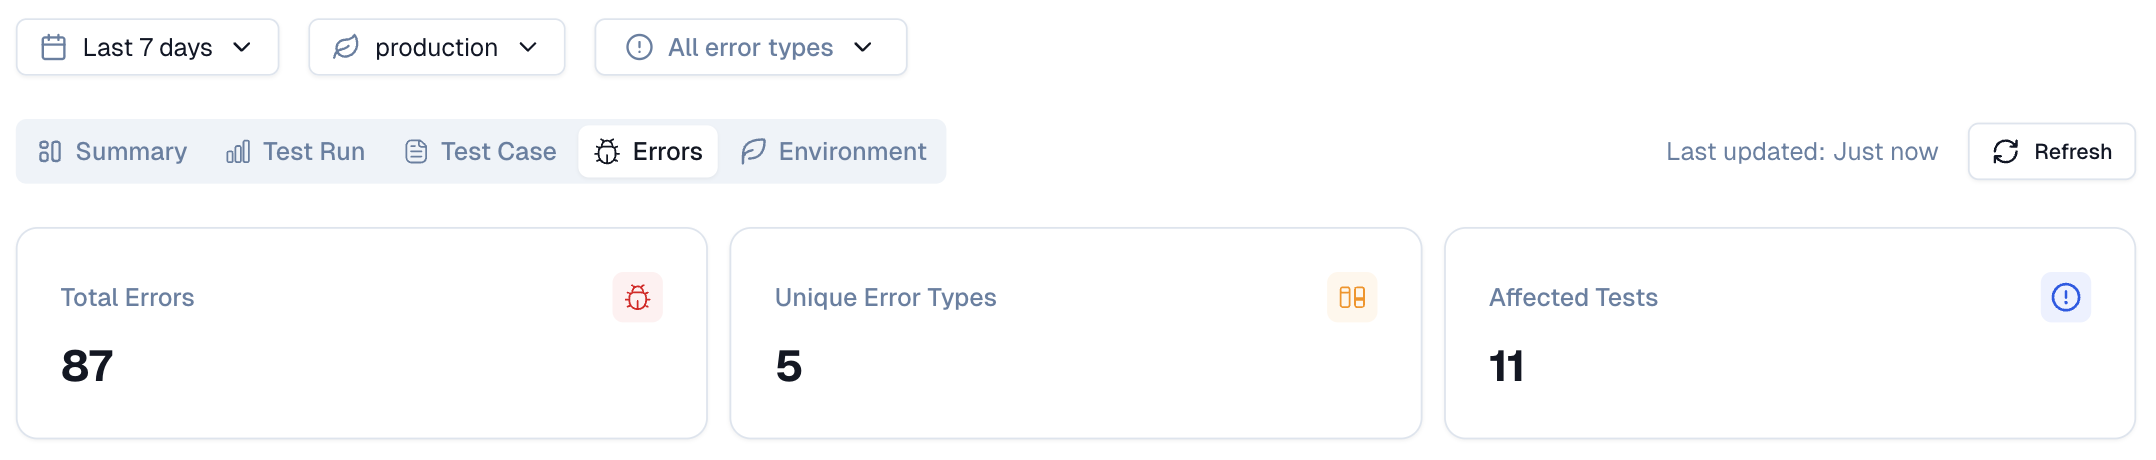
1. Total Errors
The total count of all error occurrences across every test run in the selected period. This number includes repeated errors from the same test across multiple runs.
2. Unique Error Types
The number of distinct error signatures detected. A lower count with a high total error count indicates a few recurring errors, making them good candidates for immediate attention.
3. Affected Tests
The count of unique test cases that encountered at least one error. This tells you how widespread the problem is across your test suite.
Error Message Over Time
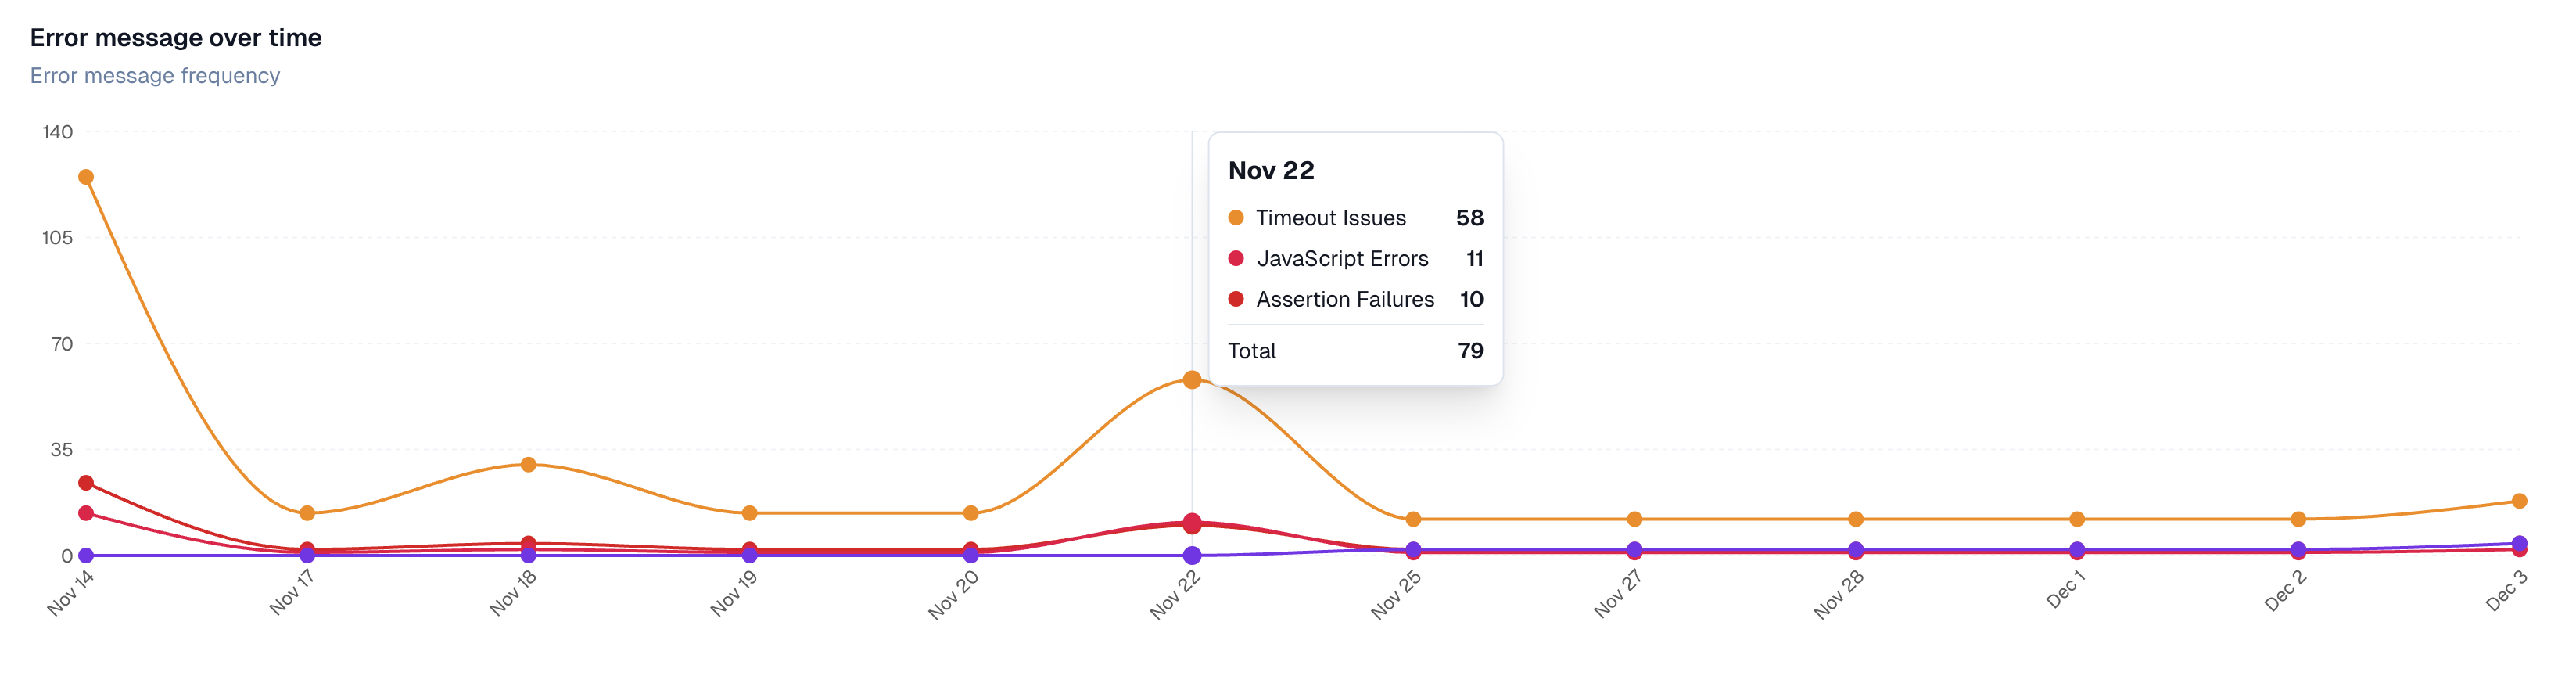
A line graph showing how each error category trends day by day. The y-axis represents the number of errors, and the x-axis shows dates within your selected period.
Each error category appears as a separate line with its own color. Hover over any point to see the exact counts for that day.
What it helps you find:
-
Spikes caused by unstable APIs
-
Recurring failures tied to UI changes
-
Slowdowns in CI that trigger timeouts
-
Selectors that break after layout shifts
-
Gradual increases that signal growing instability
-
Improvements after a fix; watch the line drop
Error Categories
A table that breaks down every error message by type and occurrences.
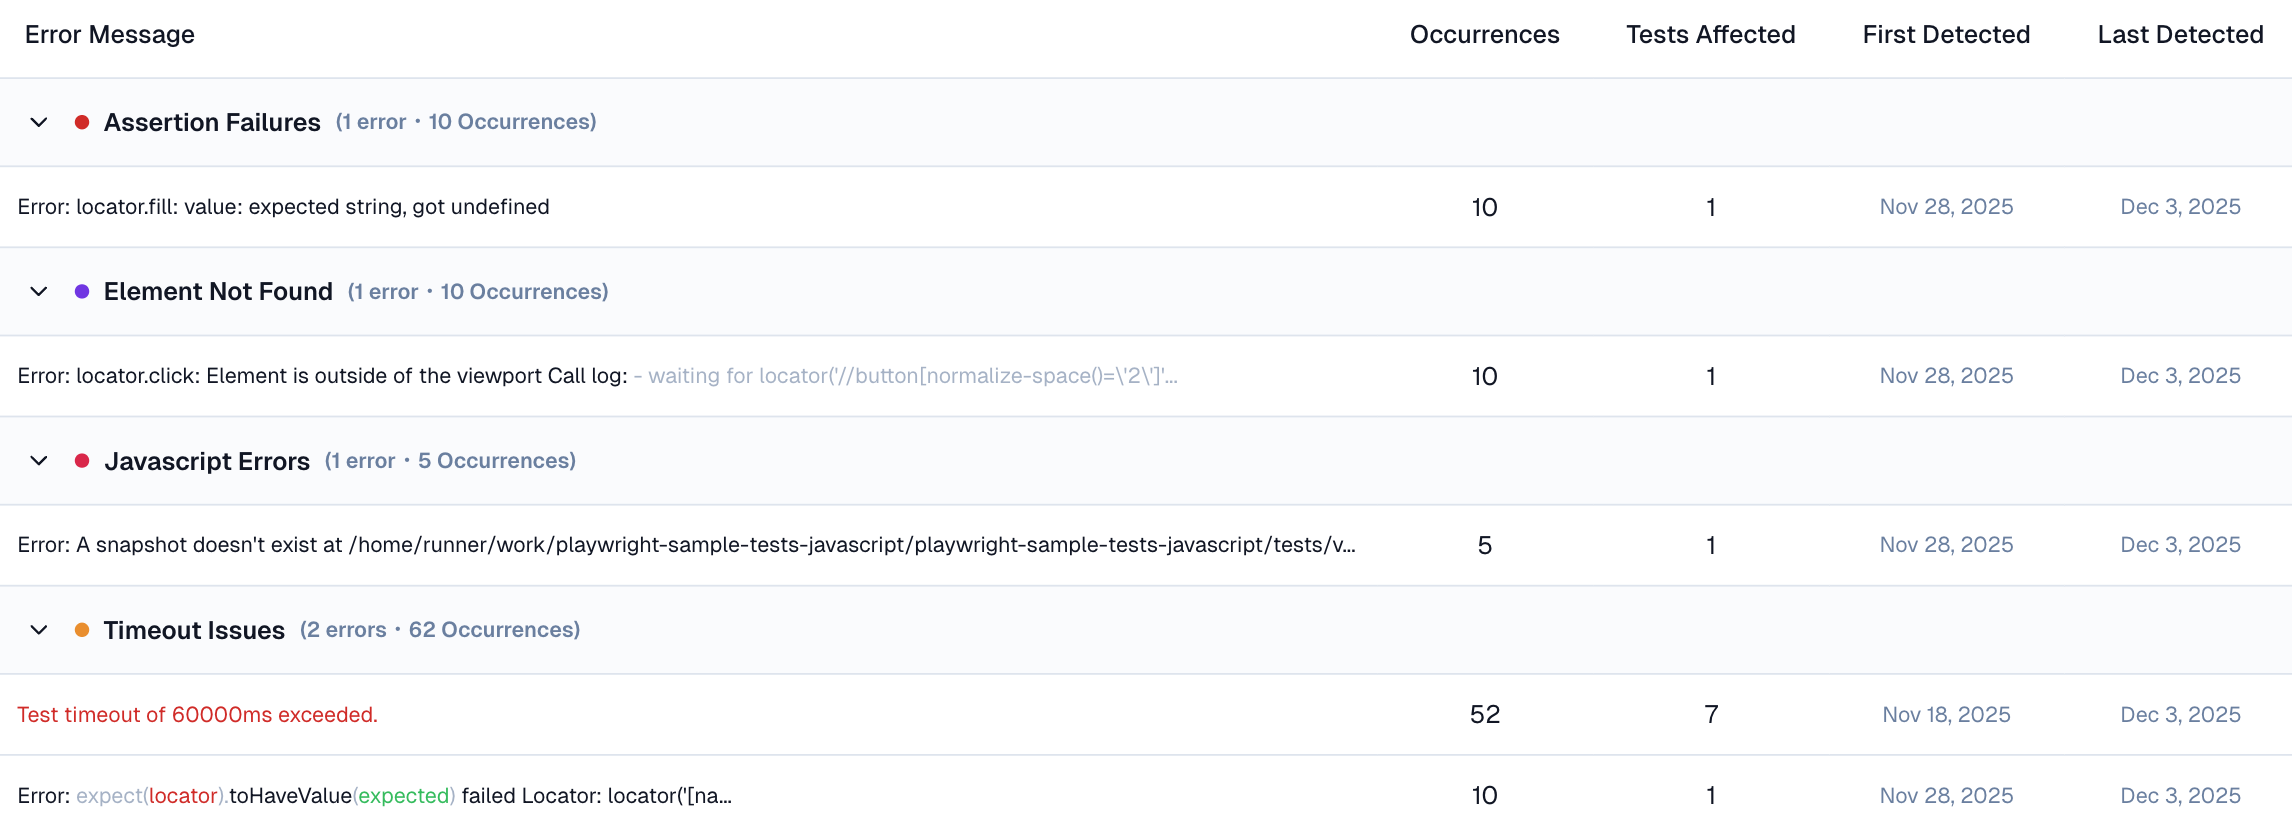
How does this work?
Each row represents an error category:
Assertion Failures, Timeout Issues, Element Not Found, Network Issues, JavaScript Errors, Browser Issues, or Other Failures.
Using the Error Types filter on top of the tab, you can either show all error types or focus on a specific category.
The category header shows two numbers: how many unique error messages fall under that type and their combined occurrence count.
Expand any category to see the individual error messages inside it.
| Column | What It Shows |
|---|---|
| Error Message | The actual error text or description returned by the test. |
| Occurrences | Total times this exact error appeared across all runs. |
| Tests Affected | Number of unique test cases that hit this error. |
| First Detected | The date this error first appeared in your project. |
| Last Detected | The most recent date this error occurred. |
Side Panel
Click any error row to open a detail panel. This panel shows every test case affected by that error.
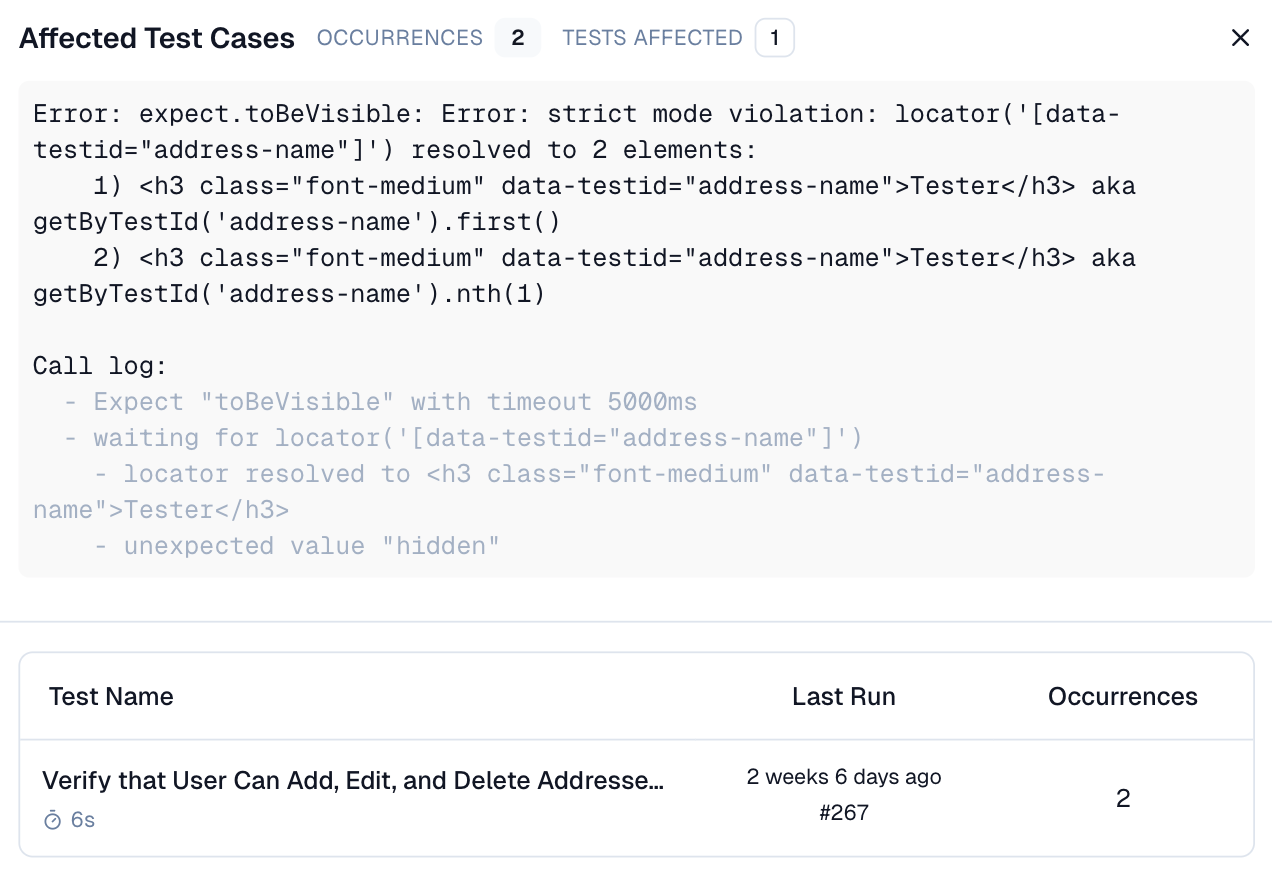
For each test case, you see:
-
Test Name: A clickable link that opens the Test Case Details page.
-
Duration: How long the test took to run.
-
Last Run: When this test last ran, with the run ID as a clickable link to the Test Run page.
-
Occurrences: How many times has this specific test hit this error?