Environment
1. Execution Results by Environment
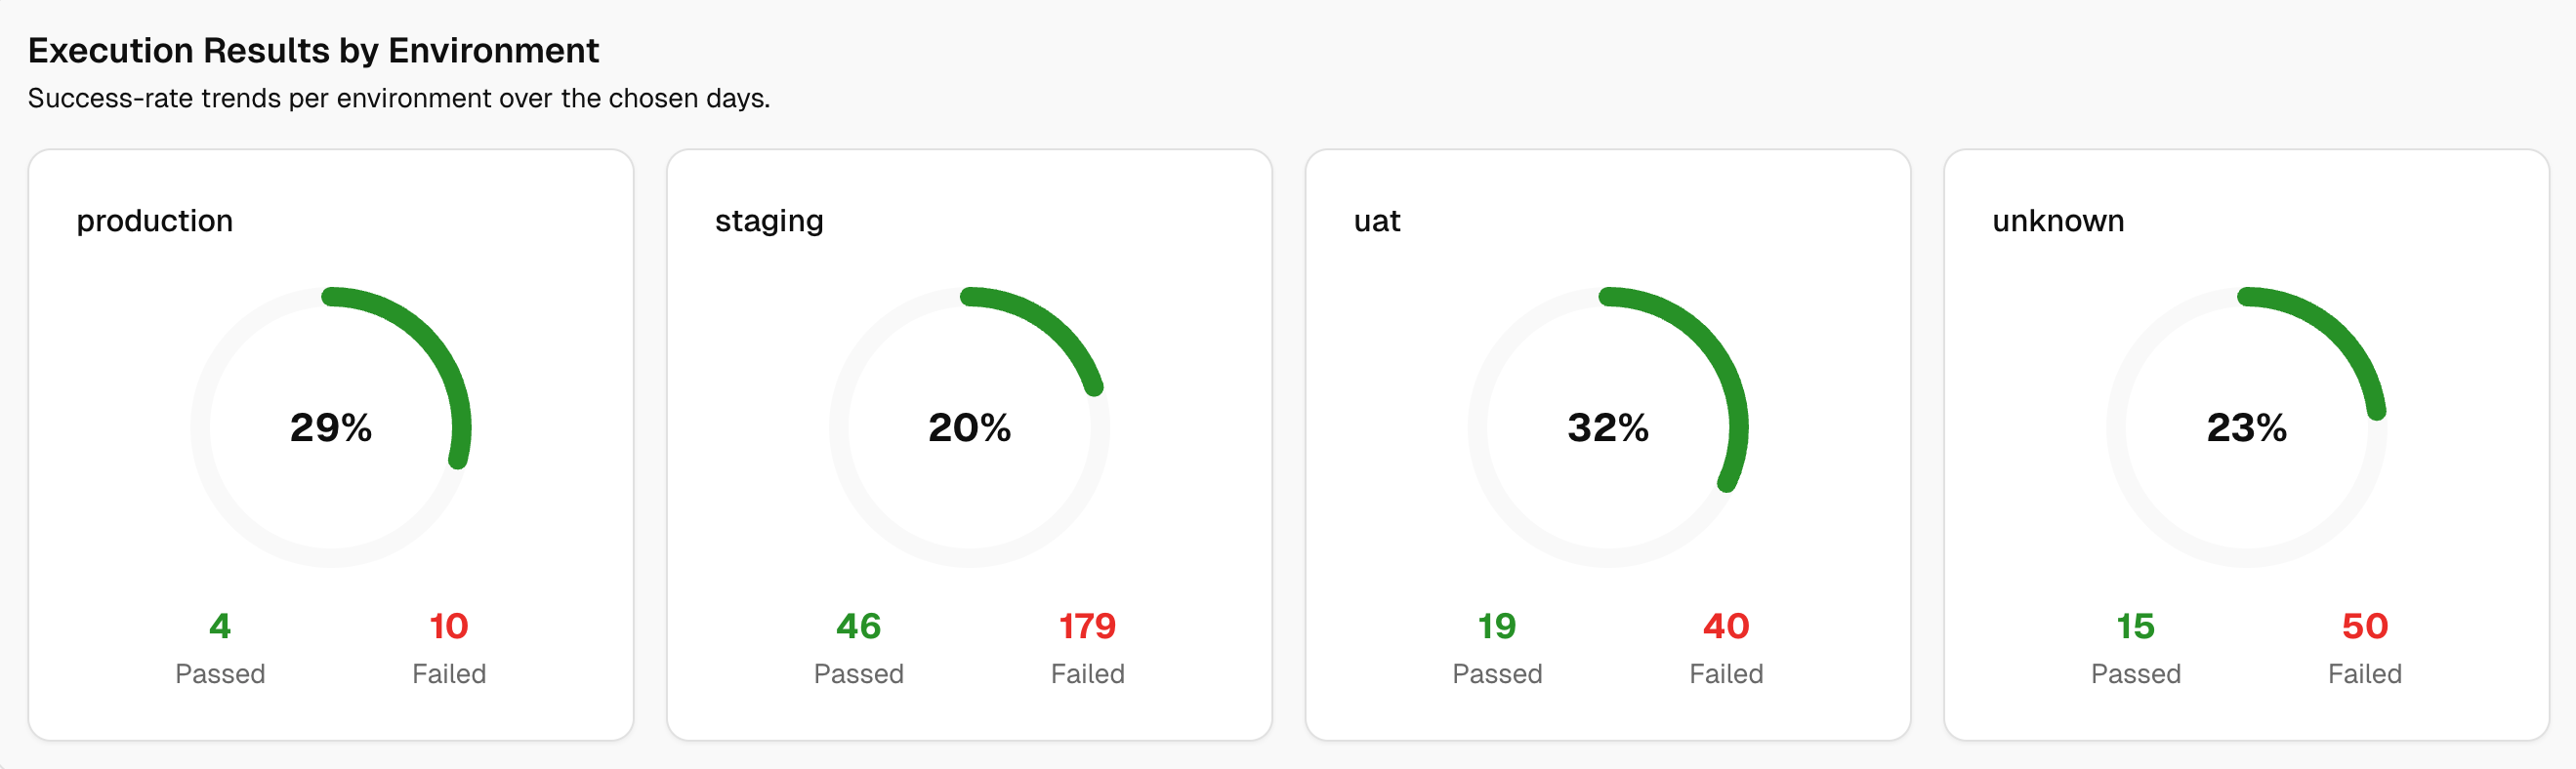
Shows the current pass rate per environment as a gauge, with passed and failed counts under each card. Here, you see which setup is weakest at a glance. If QA drops while Dev holds, you likely have data or config drift, not a code defect.
Next, open the low pass-rate card, filter to that environment, then review the latest failing runs.
2. Pass Rate Trends
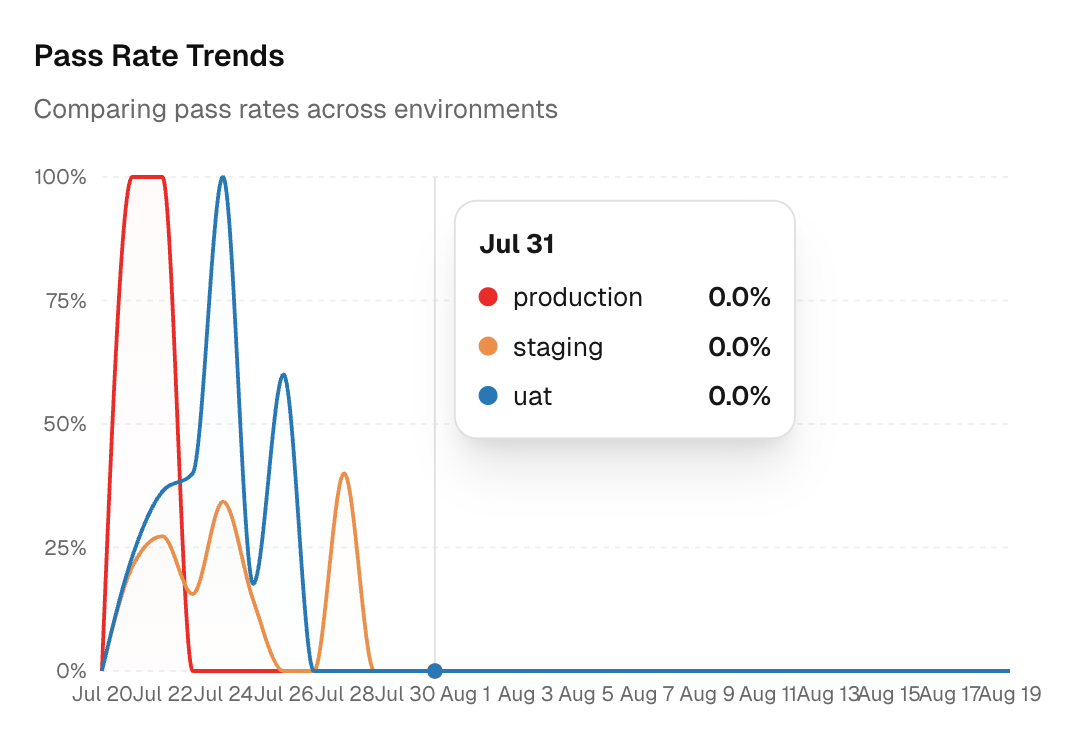
A time series comparing daily pass rate across environments.
If a line that falls only for one environment points to environment-specific issues. And a drop across all lines points to a bad commit or shared dependency.
Further, match the drop date to recent PRs and dependency bumps. Re-run on a second environment to confirm the scope.
3. Test Run Volume
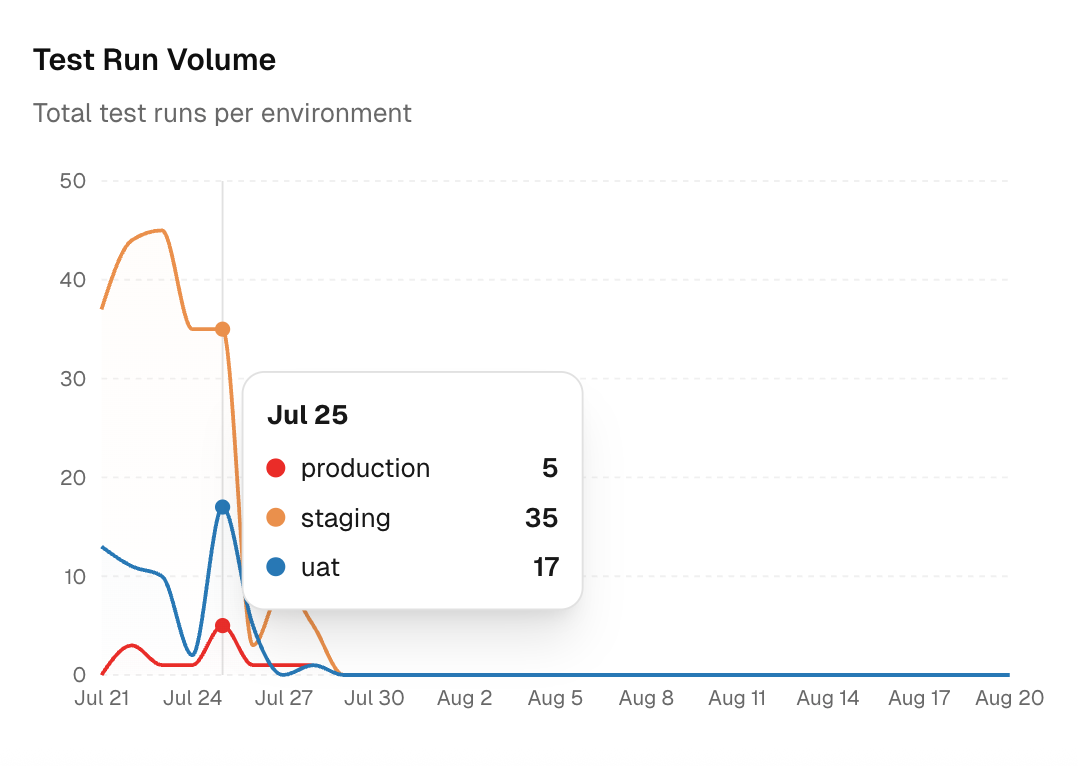
A time series showing total tests executed per environment each day. The spikes here mean higher load or broader coverage. Dips can signal CI outages, skipped jobs, or misconfigured triggers.
So, if growth is steady, plan shards and container size. If volume falls, check schedules and pipeline filters.
4. Environment Analysis
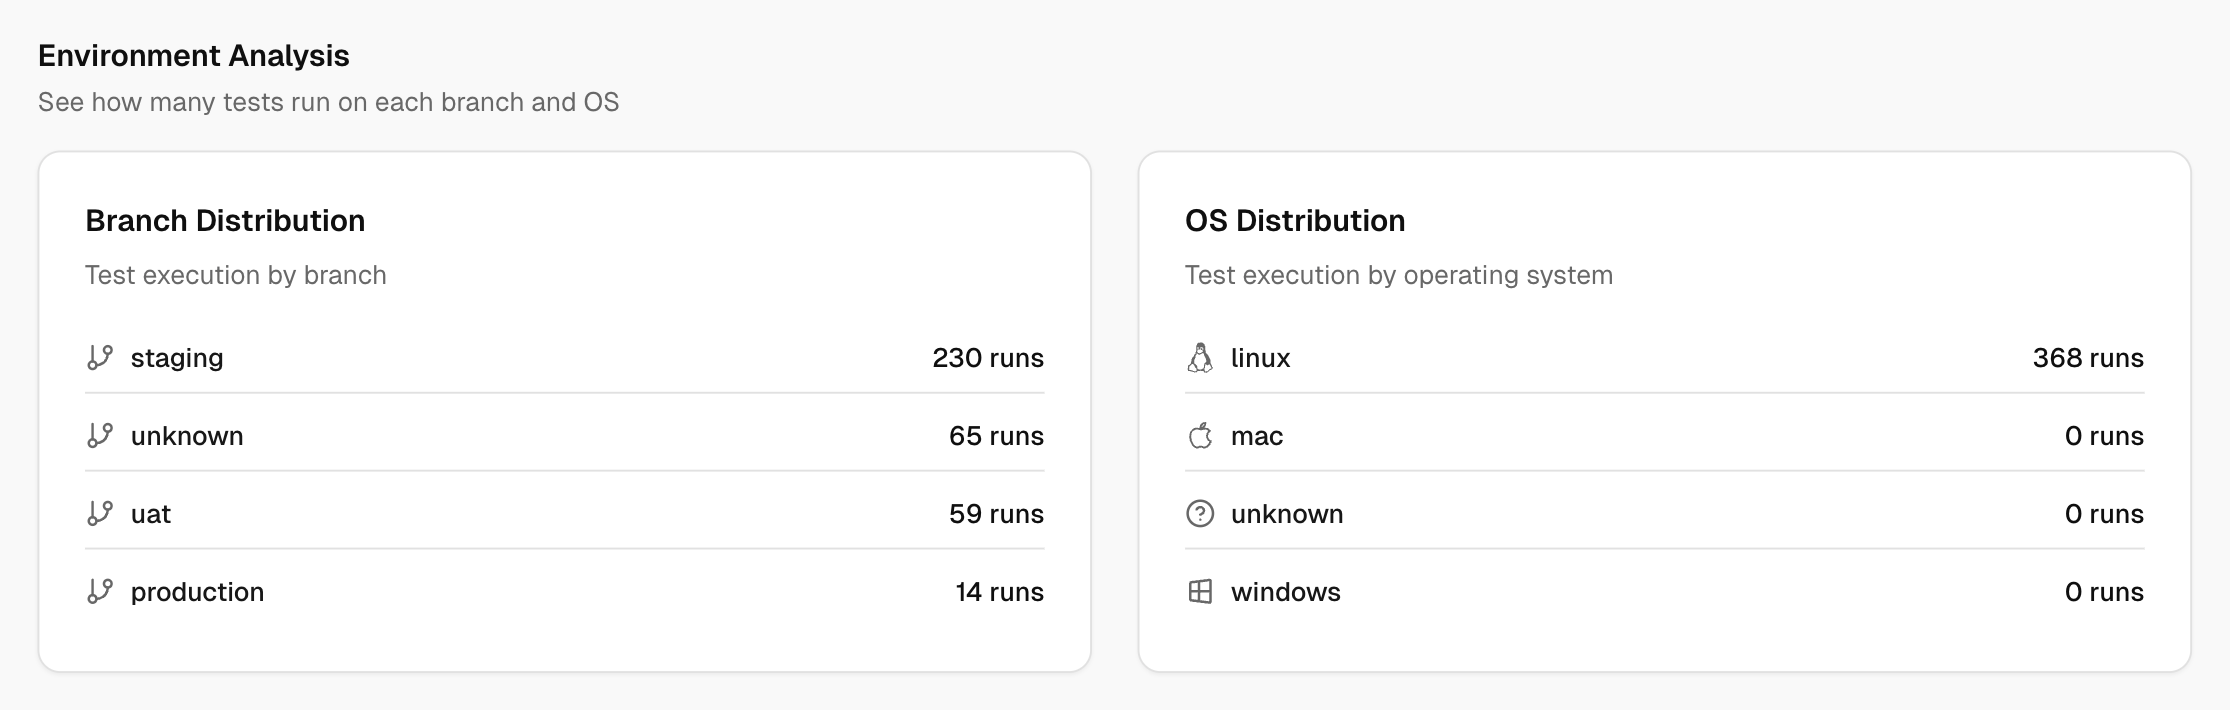
Two breakdowns that tell you where tests run.
-
Branch Distribution
Runs per branch inside each environment. It finds neglected branches and helps spread CI load. If a long-lived branch has few runs, the risk is building. You can add scheduled runs or gate merges on fresh results for that branch.
-
OS Distribution
Runs are distributed by the operating system. It confirms that execution matches your user base. A skew to one OS can hide platform bugs. You can adjust runners so critical OS targets get regular coverage.
The "Unknown" bucket groups run without a mapped environment or OS. Map branches in Settings to reduce this bucket.