Summary
1. Test Run Volume
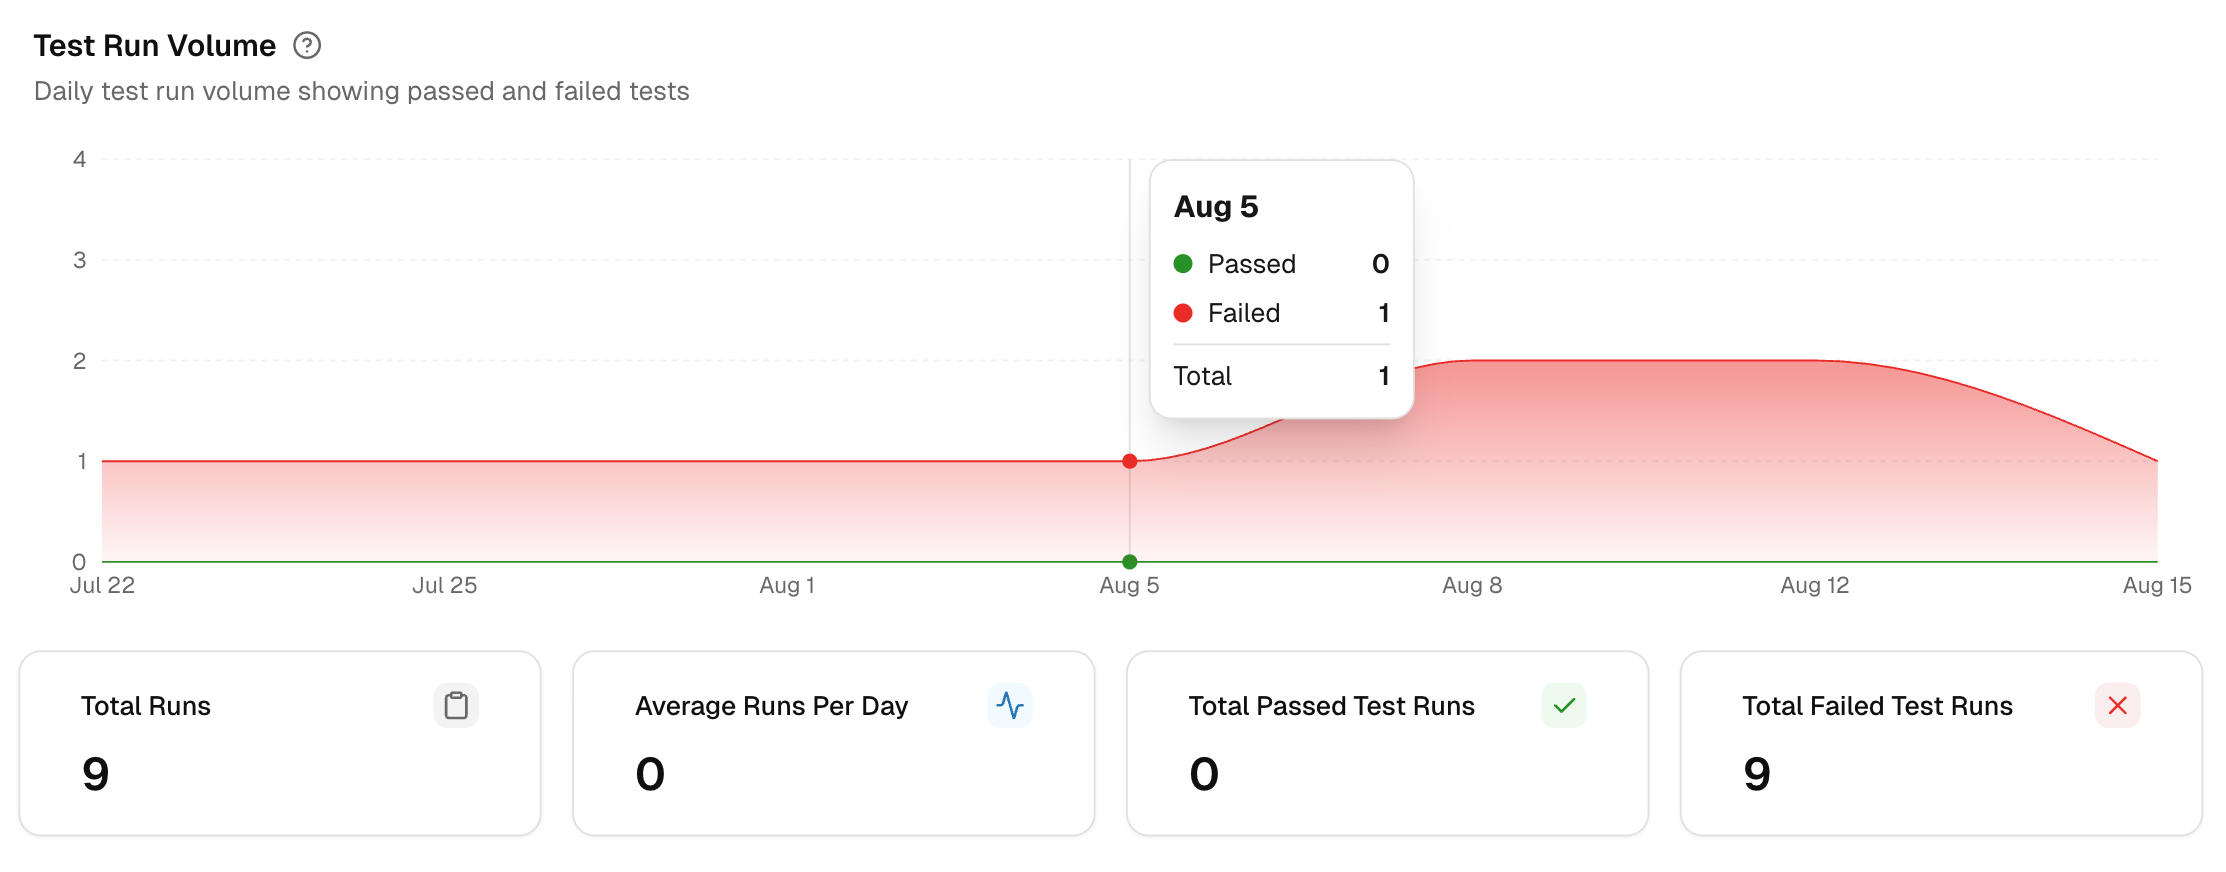
This graph displays the daily count of test runs that were either passed or failed. It helps you quickly understand the volume of tests executed during the selected time range.
If you notice a sudden drop or spike in the number of runs, it could indicate potential issues in your pipeline or test configuration.
Click any day to open the runs from that date, then link changes to the result you see. Filter by environment to isolate noise from one setup.
-
Total Runs shows how much testing happened in the selected window. It is your baseline for coverage and for any comparisons you plan to make.
-
Average Runs Per Day smooths out spikes so you can track cadence. Dips can reveal CI outages or paused pipelines.
-
Total Passed Test Runs is a quick readiness signal. Use it to prove stability after a fix or refactor.
-
Total Failed Test Runs highlights risk. Open the day with the largest bar, then drill into failing runs to find the source branch or PR.
If your CI auto-retries failures, volume can rise without a code change. Read this chart next to Test Retry Trends to avoid false alarms.
2. Flakiness: Average Flakiness
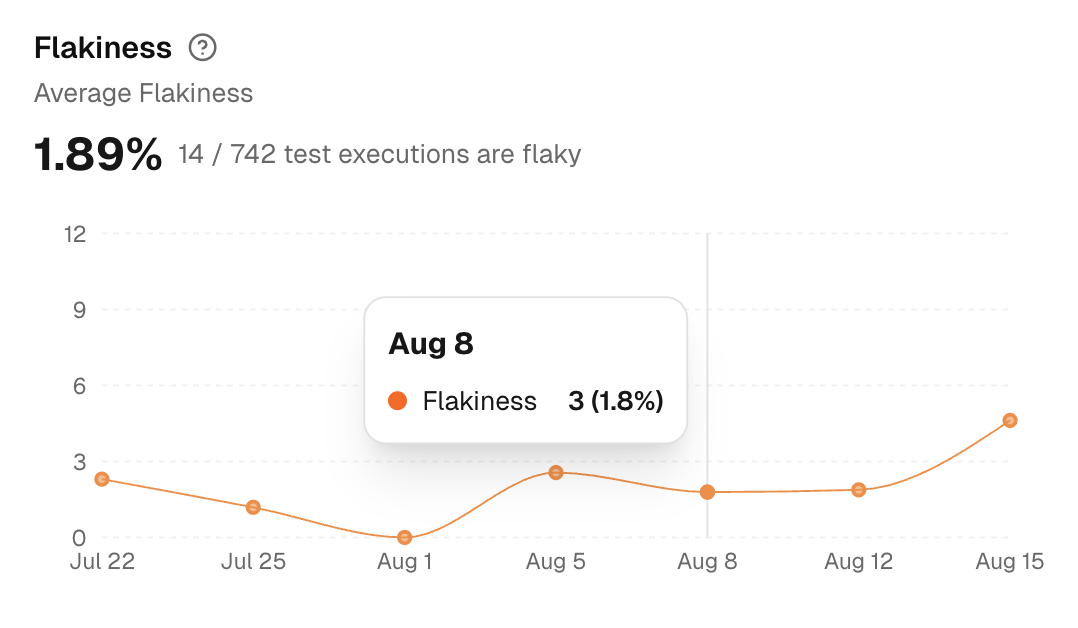
Flakiness measures the percentage of tests that yield inconsistent results. For example, some tests may pass in one run but fail in the next, indicating instability.
A high flakiness percentage means you need to address unstable tests, which could be masking real issues or slowing down your testing process.
3. New Failures: New Failure Rate
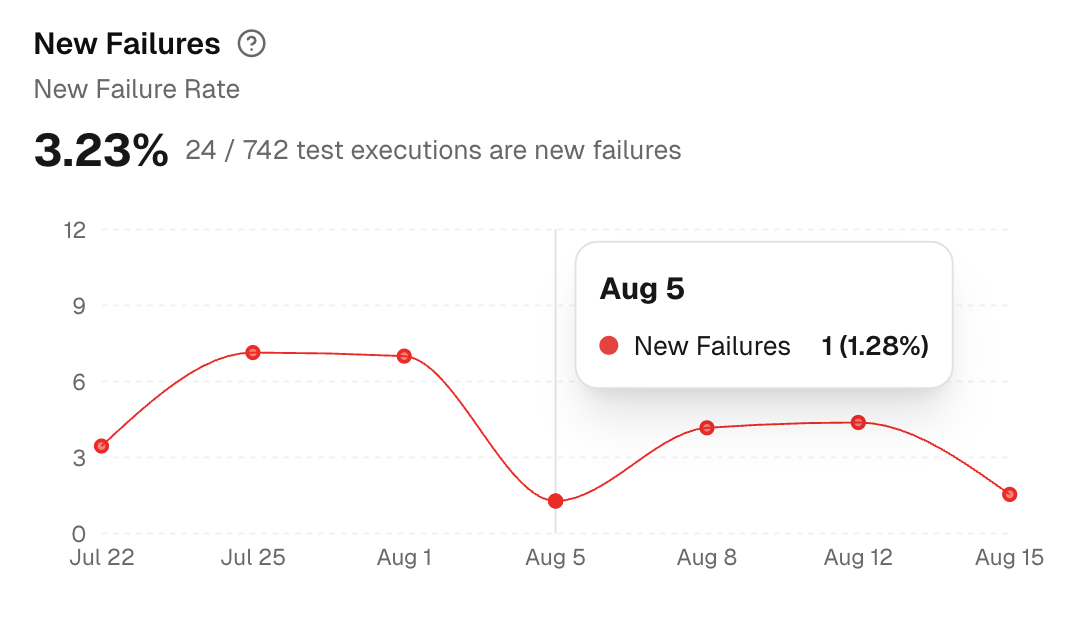
The New Failures graph tracks the percentage of tests that have failed in the current run, which were not failing in previous test runs.
This helps you quickly spot any new issues introduced into the codebase, so you can prioritize fixing them.
4. Test Retry Trends
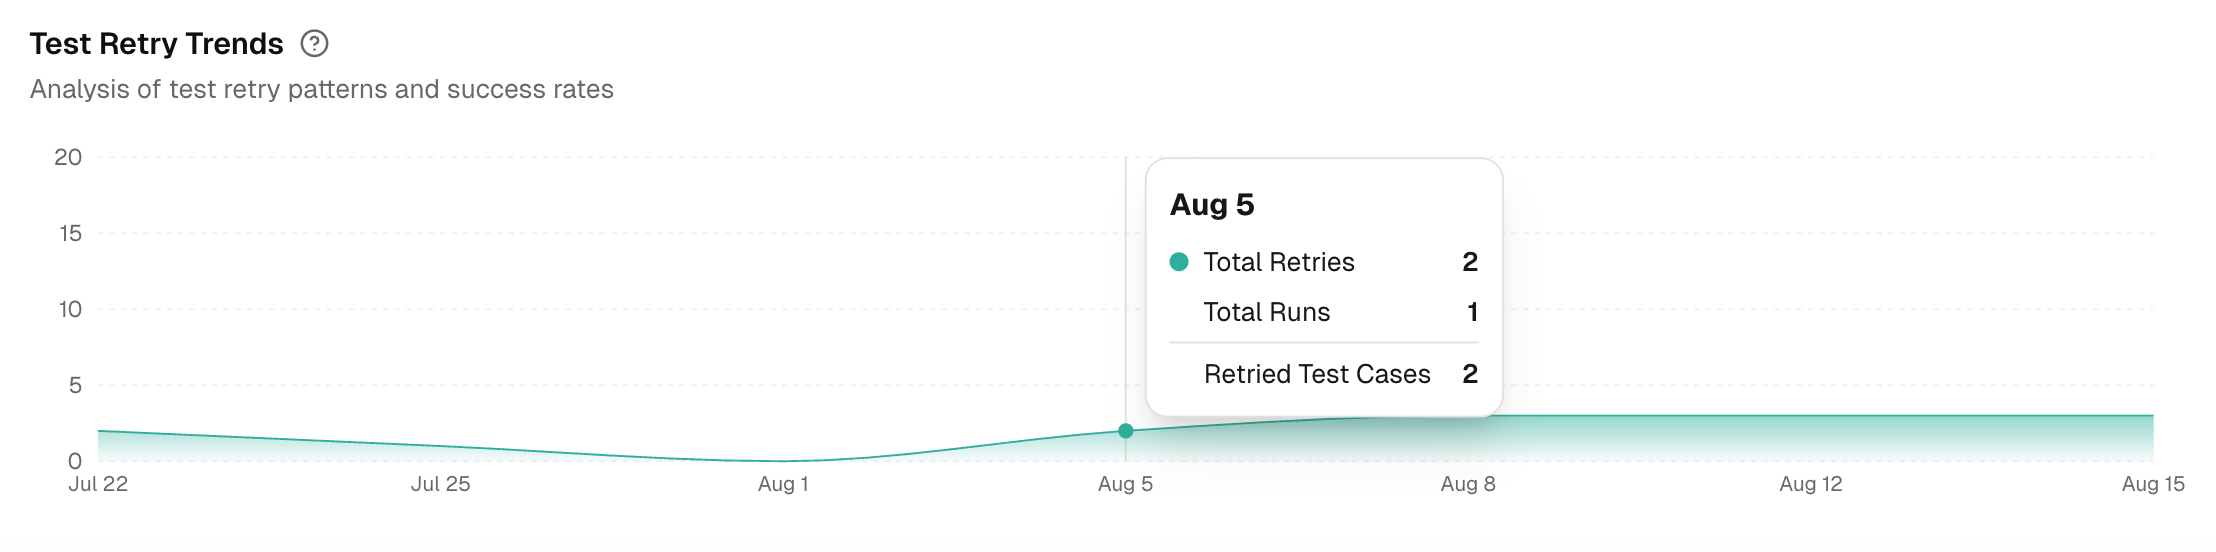
This graph visualizes the success rate of test retries and shows patterns in how often tests are re-run.
By analyzing retry trends, you can identify tests that consistently fail and need attention. It also helps determine if certain retries succeed more often, revealing issues in the test setup or environment.
New failures that only pass after retries are strong regression signals. Fix those first.