Test case
1. Average Test Cases
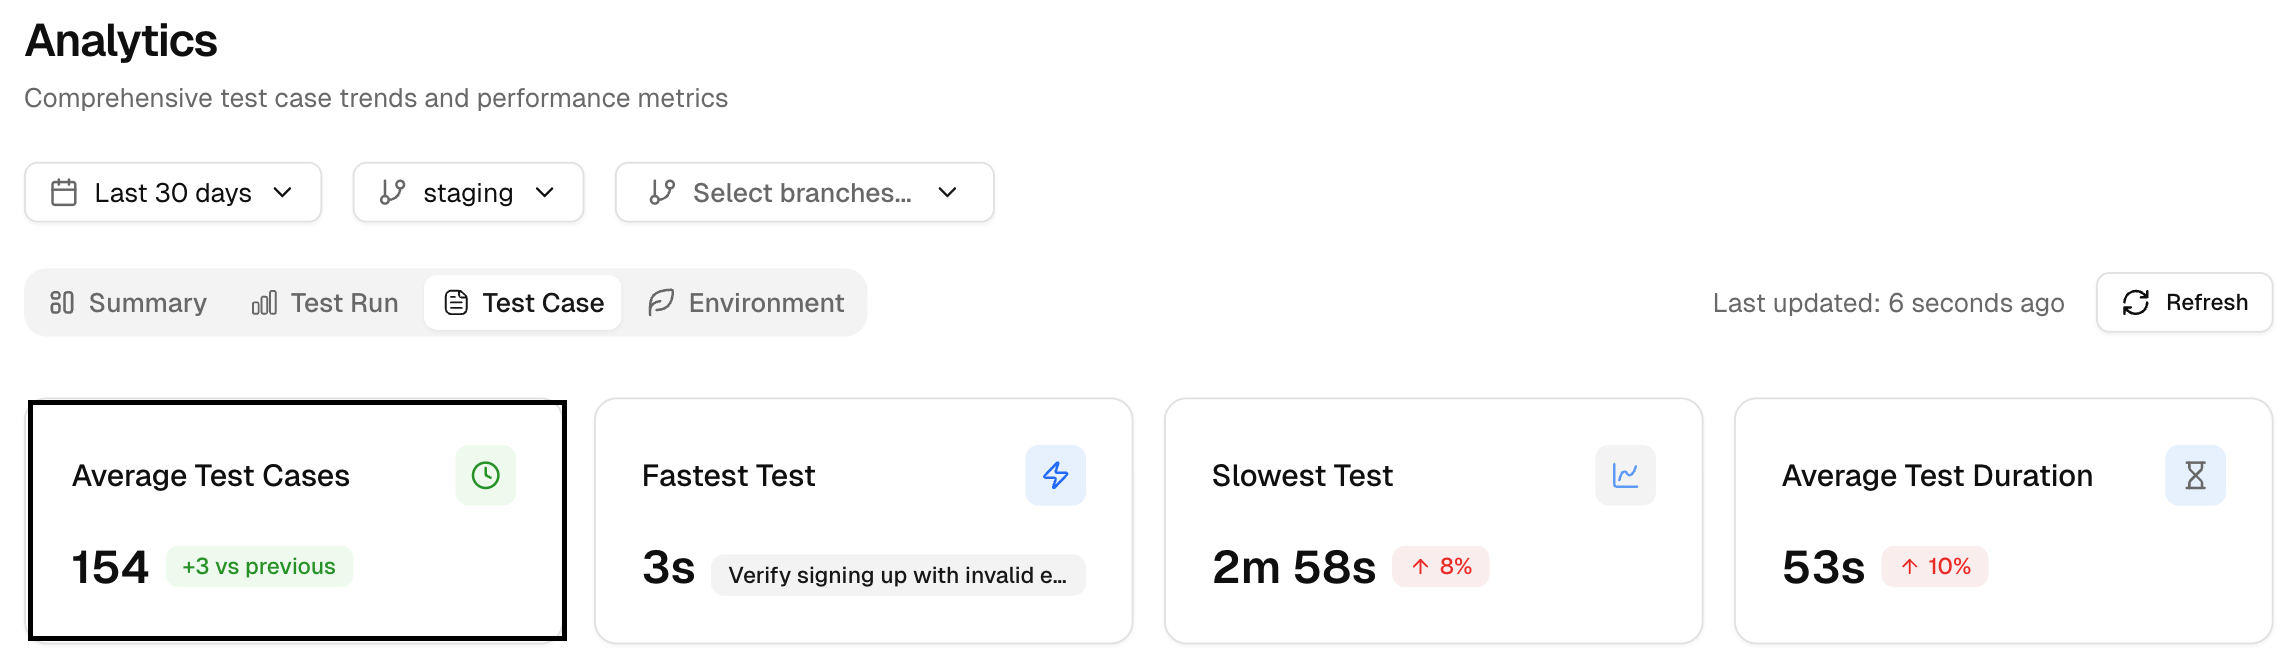
It shows the average number of test cases per run. It often tracks with runtime. If this rises while speed holds steady, your parallelism or caching is working.
2. Fastest Test
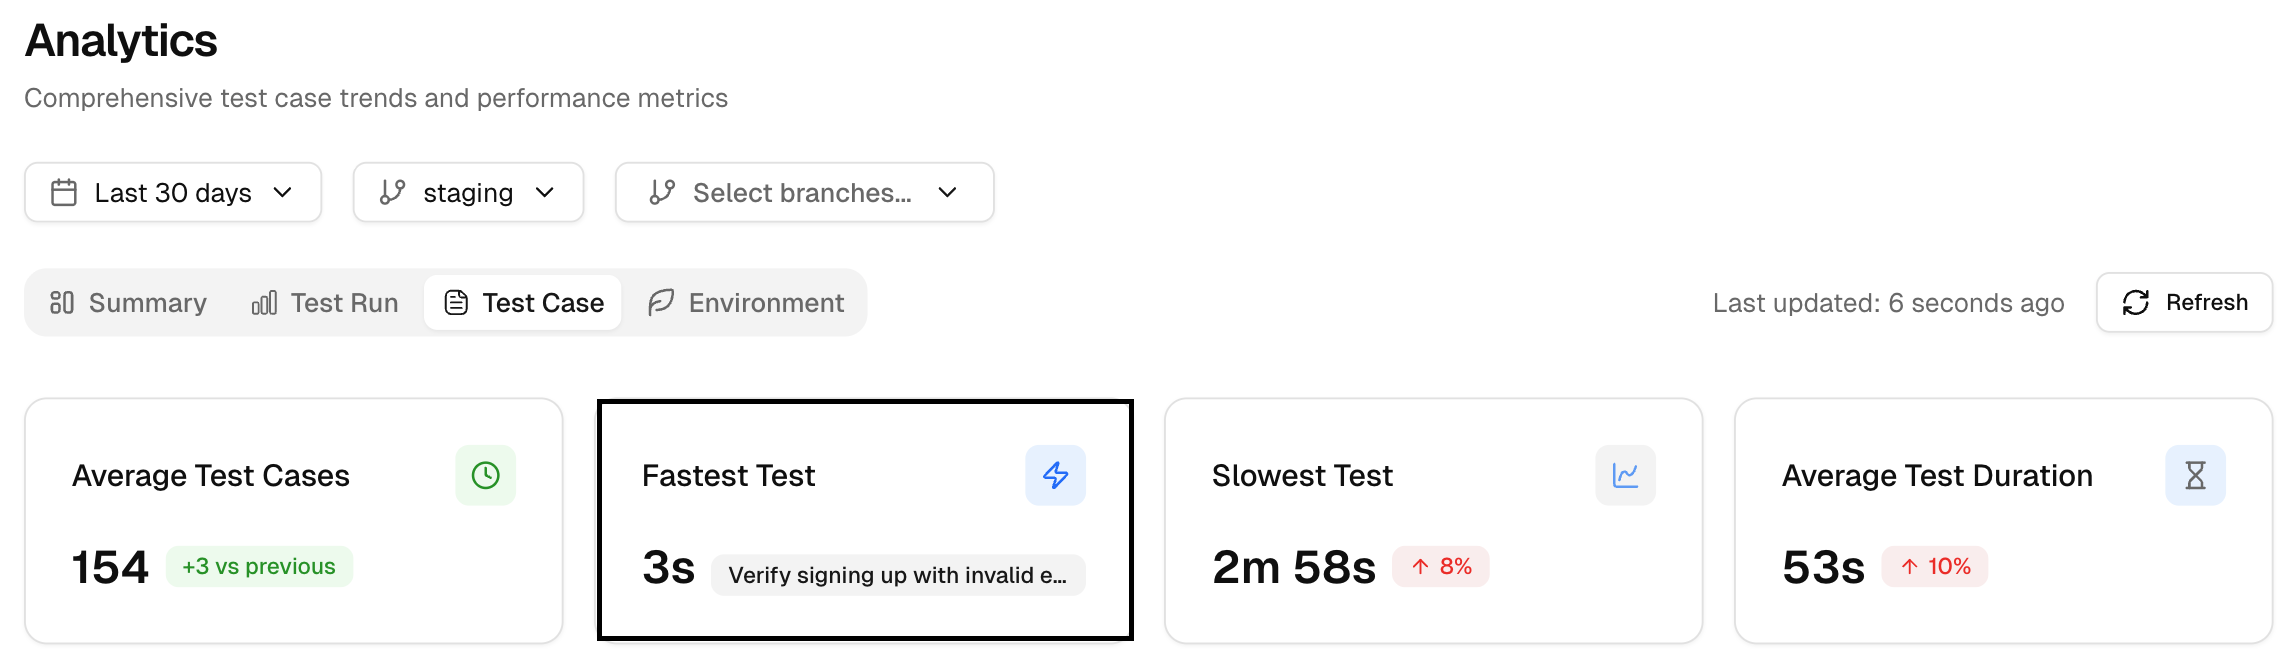
The quickest single test in the period. Use it as a small benchmark for well-scoped checks.
3. Slowest Test
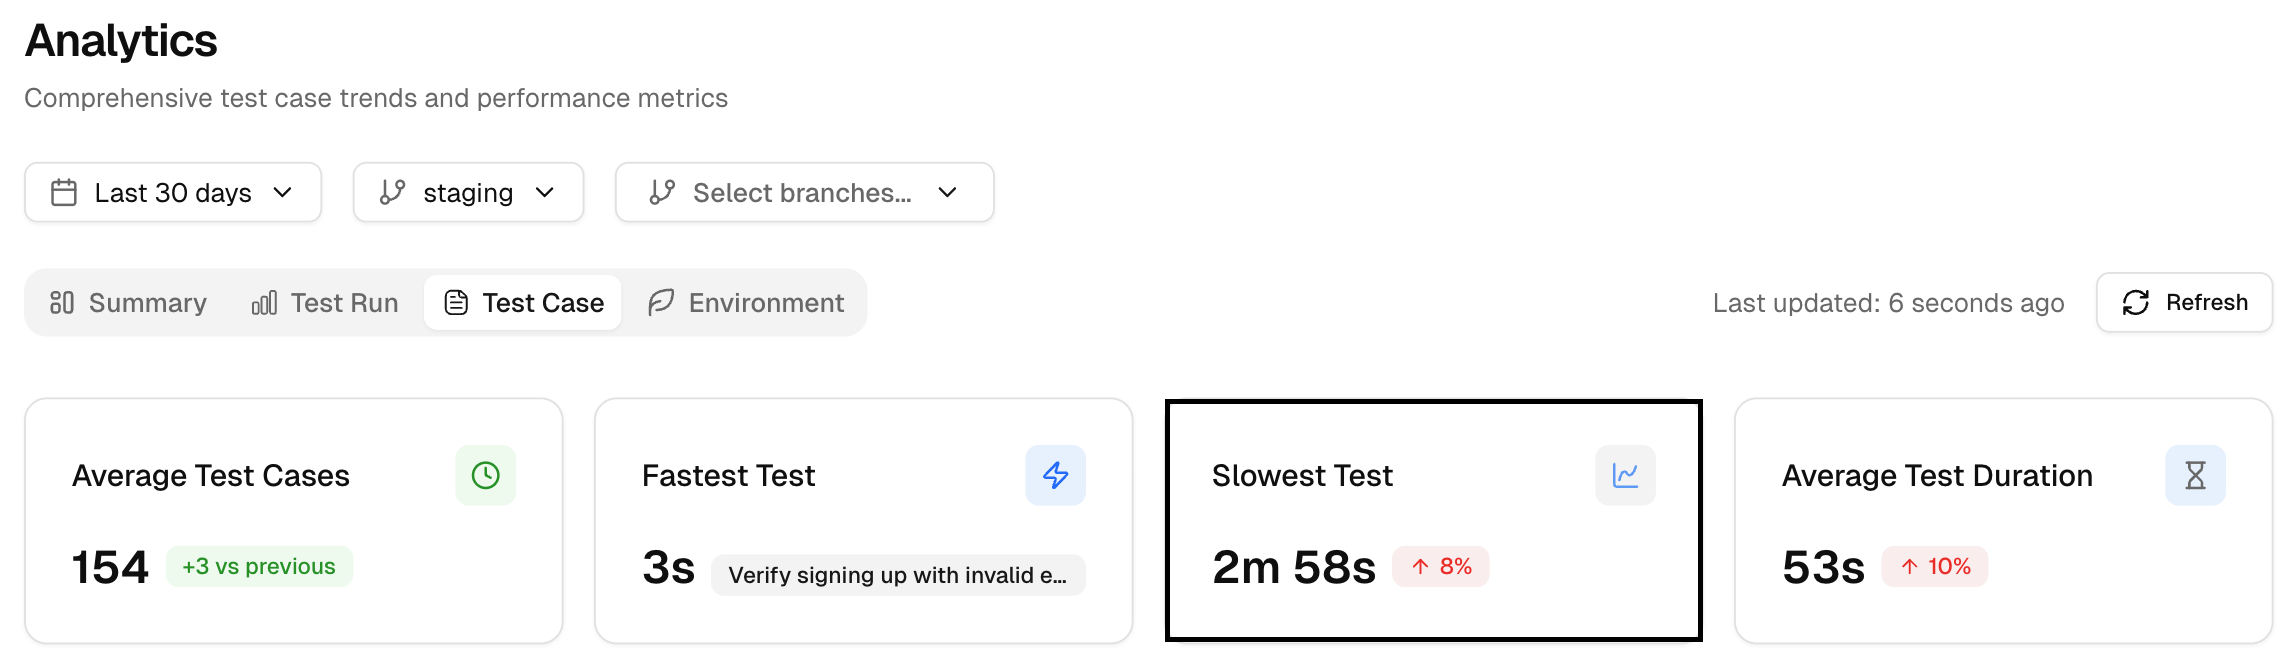
The slowest single test in the period. It is your top profiling target. By comparing test execution times, you can identify performance bottlenecks and focus on optimizing slow tests.
4. Average Test Duration
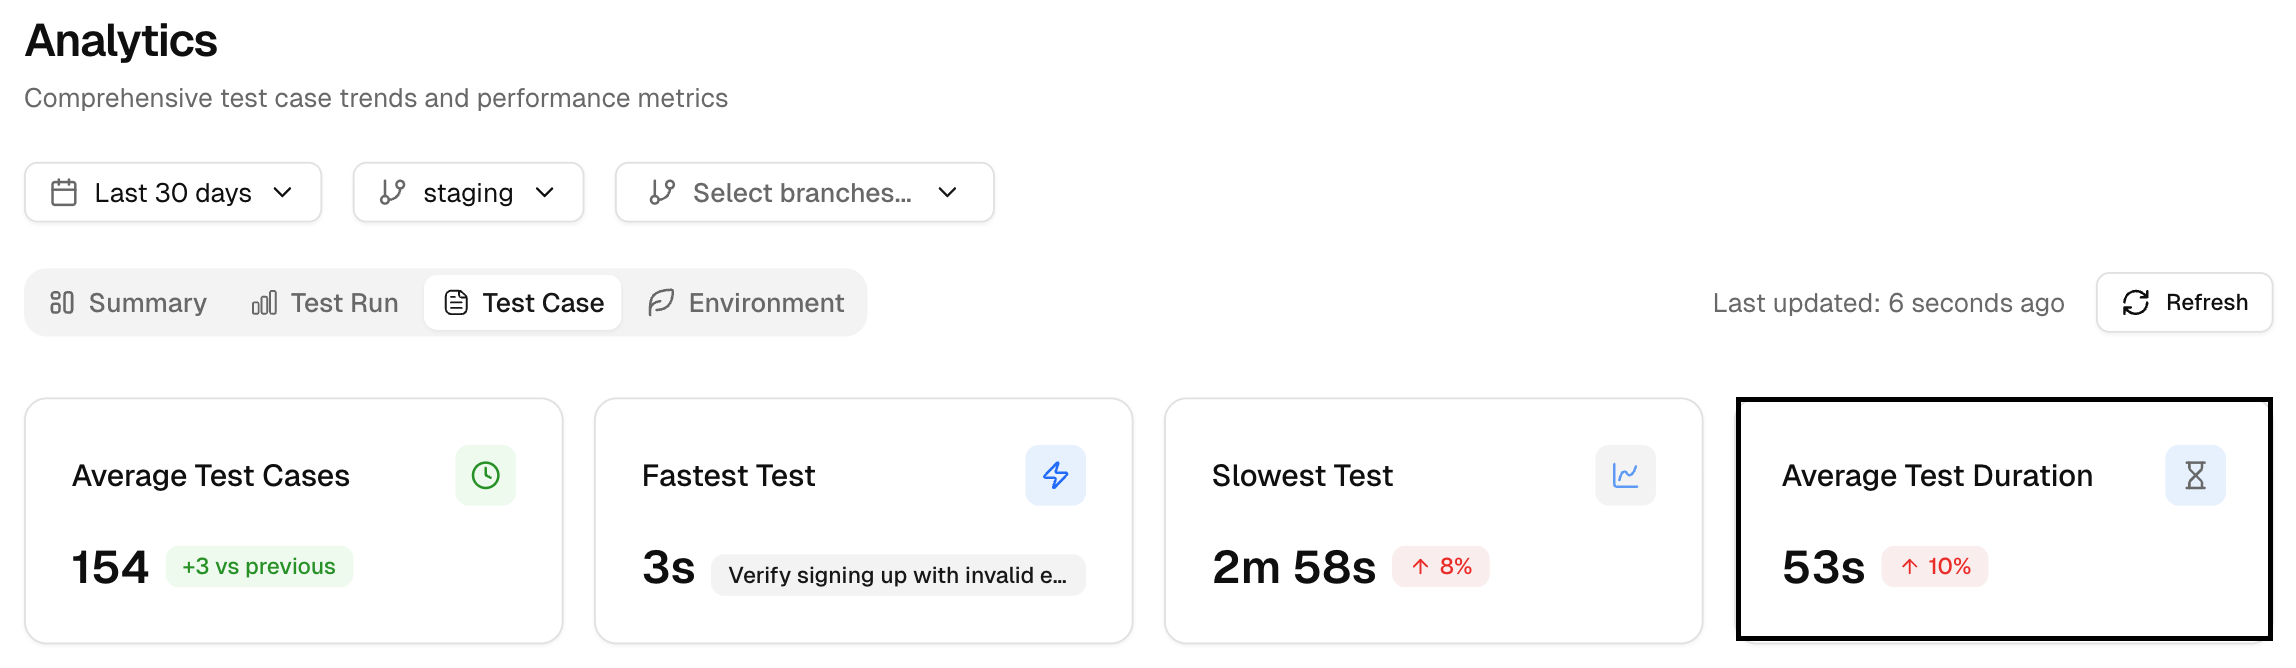
This shows the average time for all test cases to execute. If some tests are consistently taking too long, this could indicate areas for optimization in the test setup or test cases themselves.
5. Slowest Test Cases
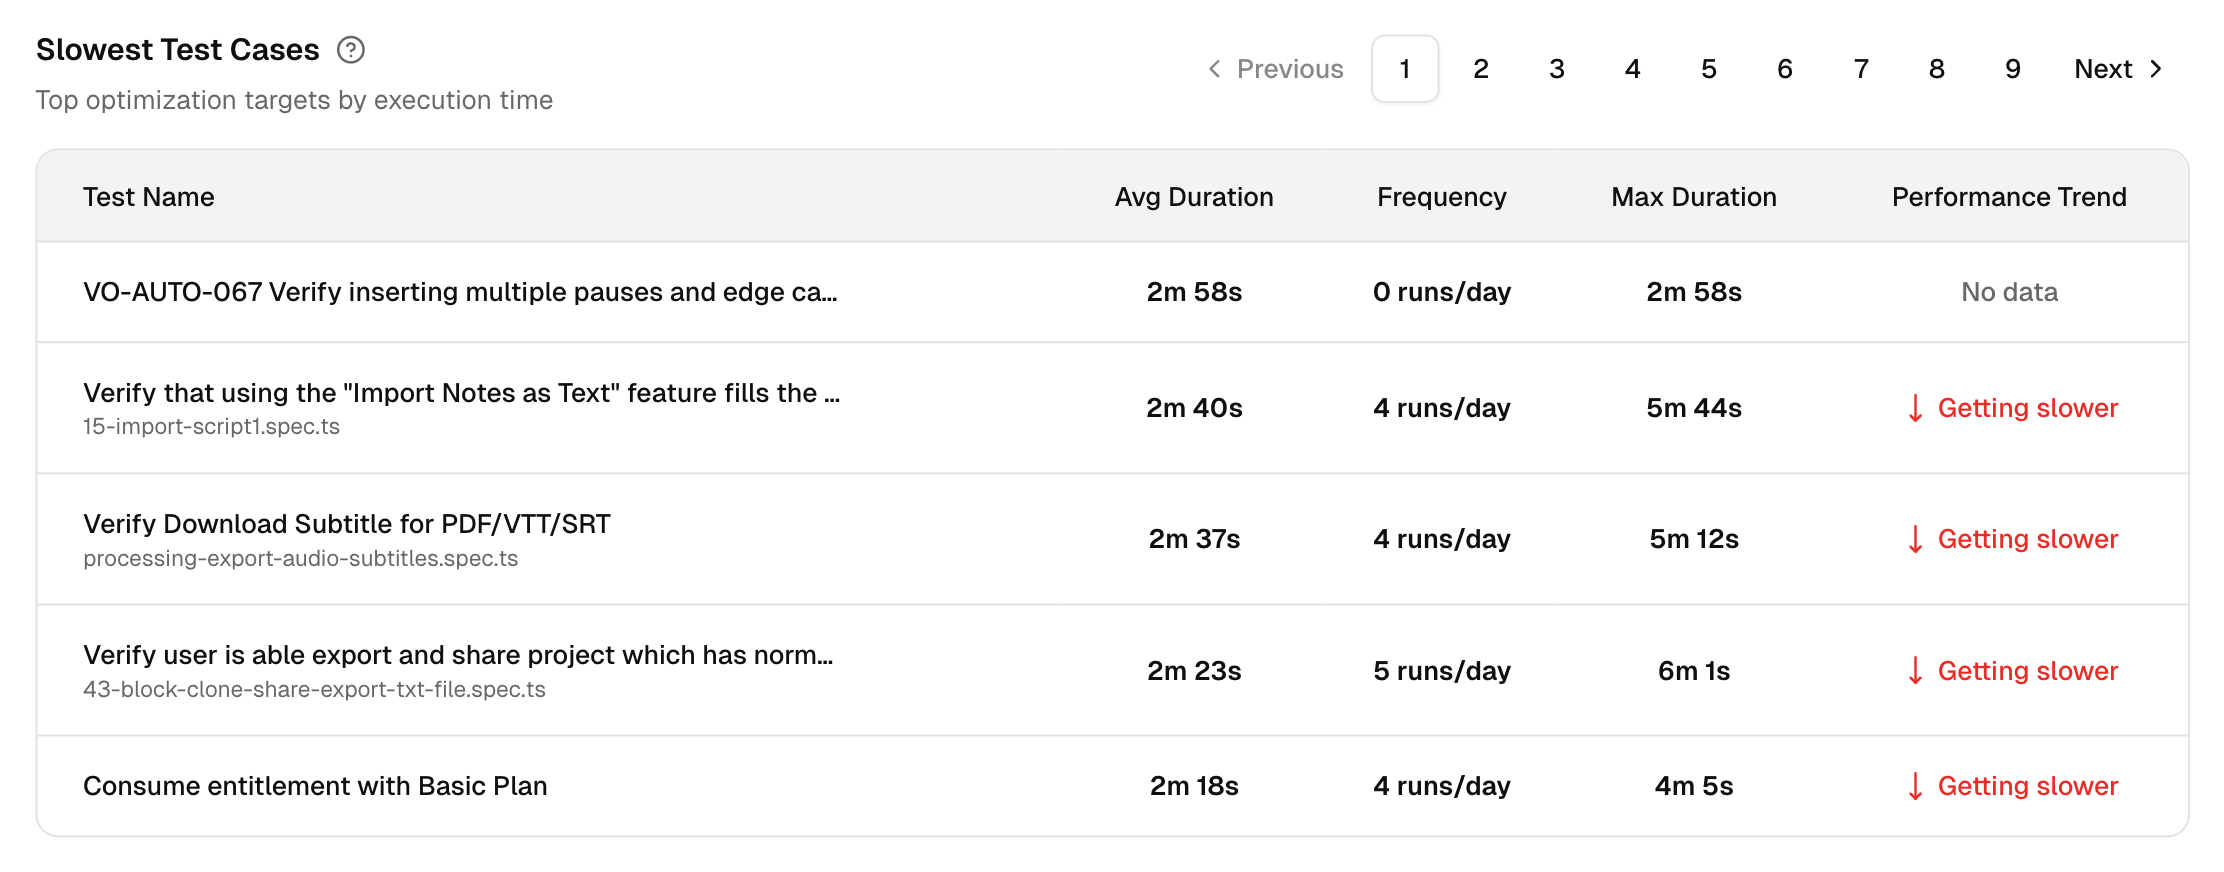
This table shows the test cases that take the longest to execute, allowing you to prioritize them for optimization.
This helps focus attention on the most time-consuming tests, which could be negatively impacting your test execution time.
6. Test Cases Pass/Fail History
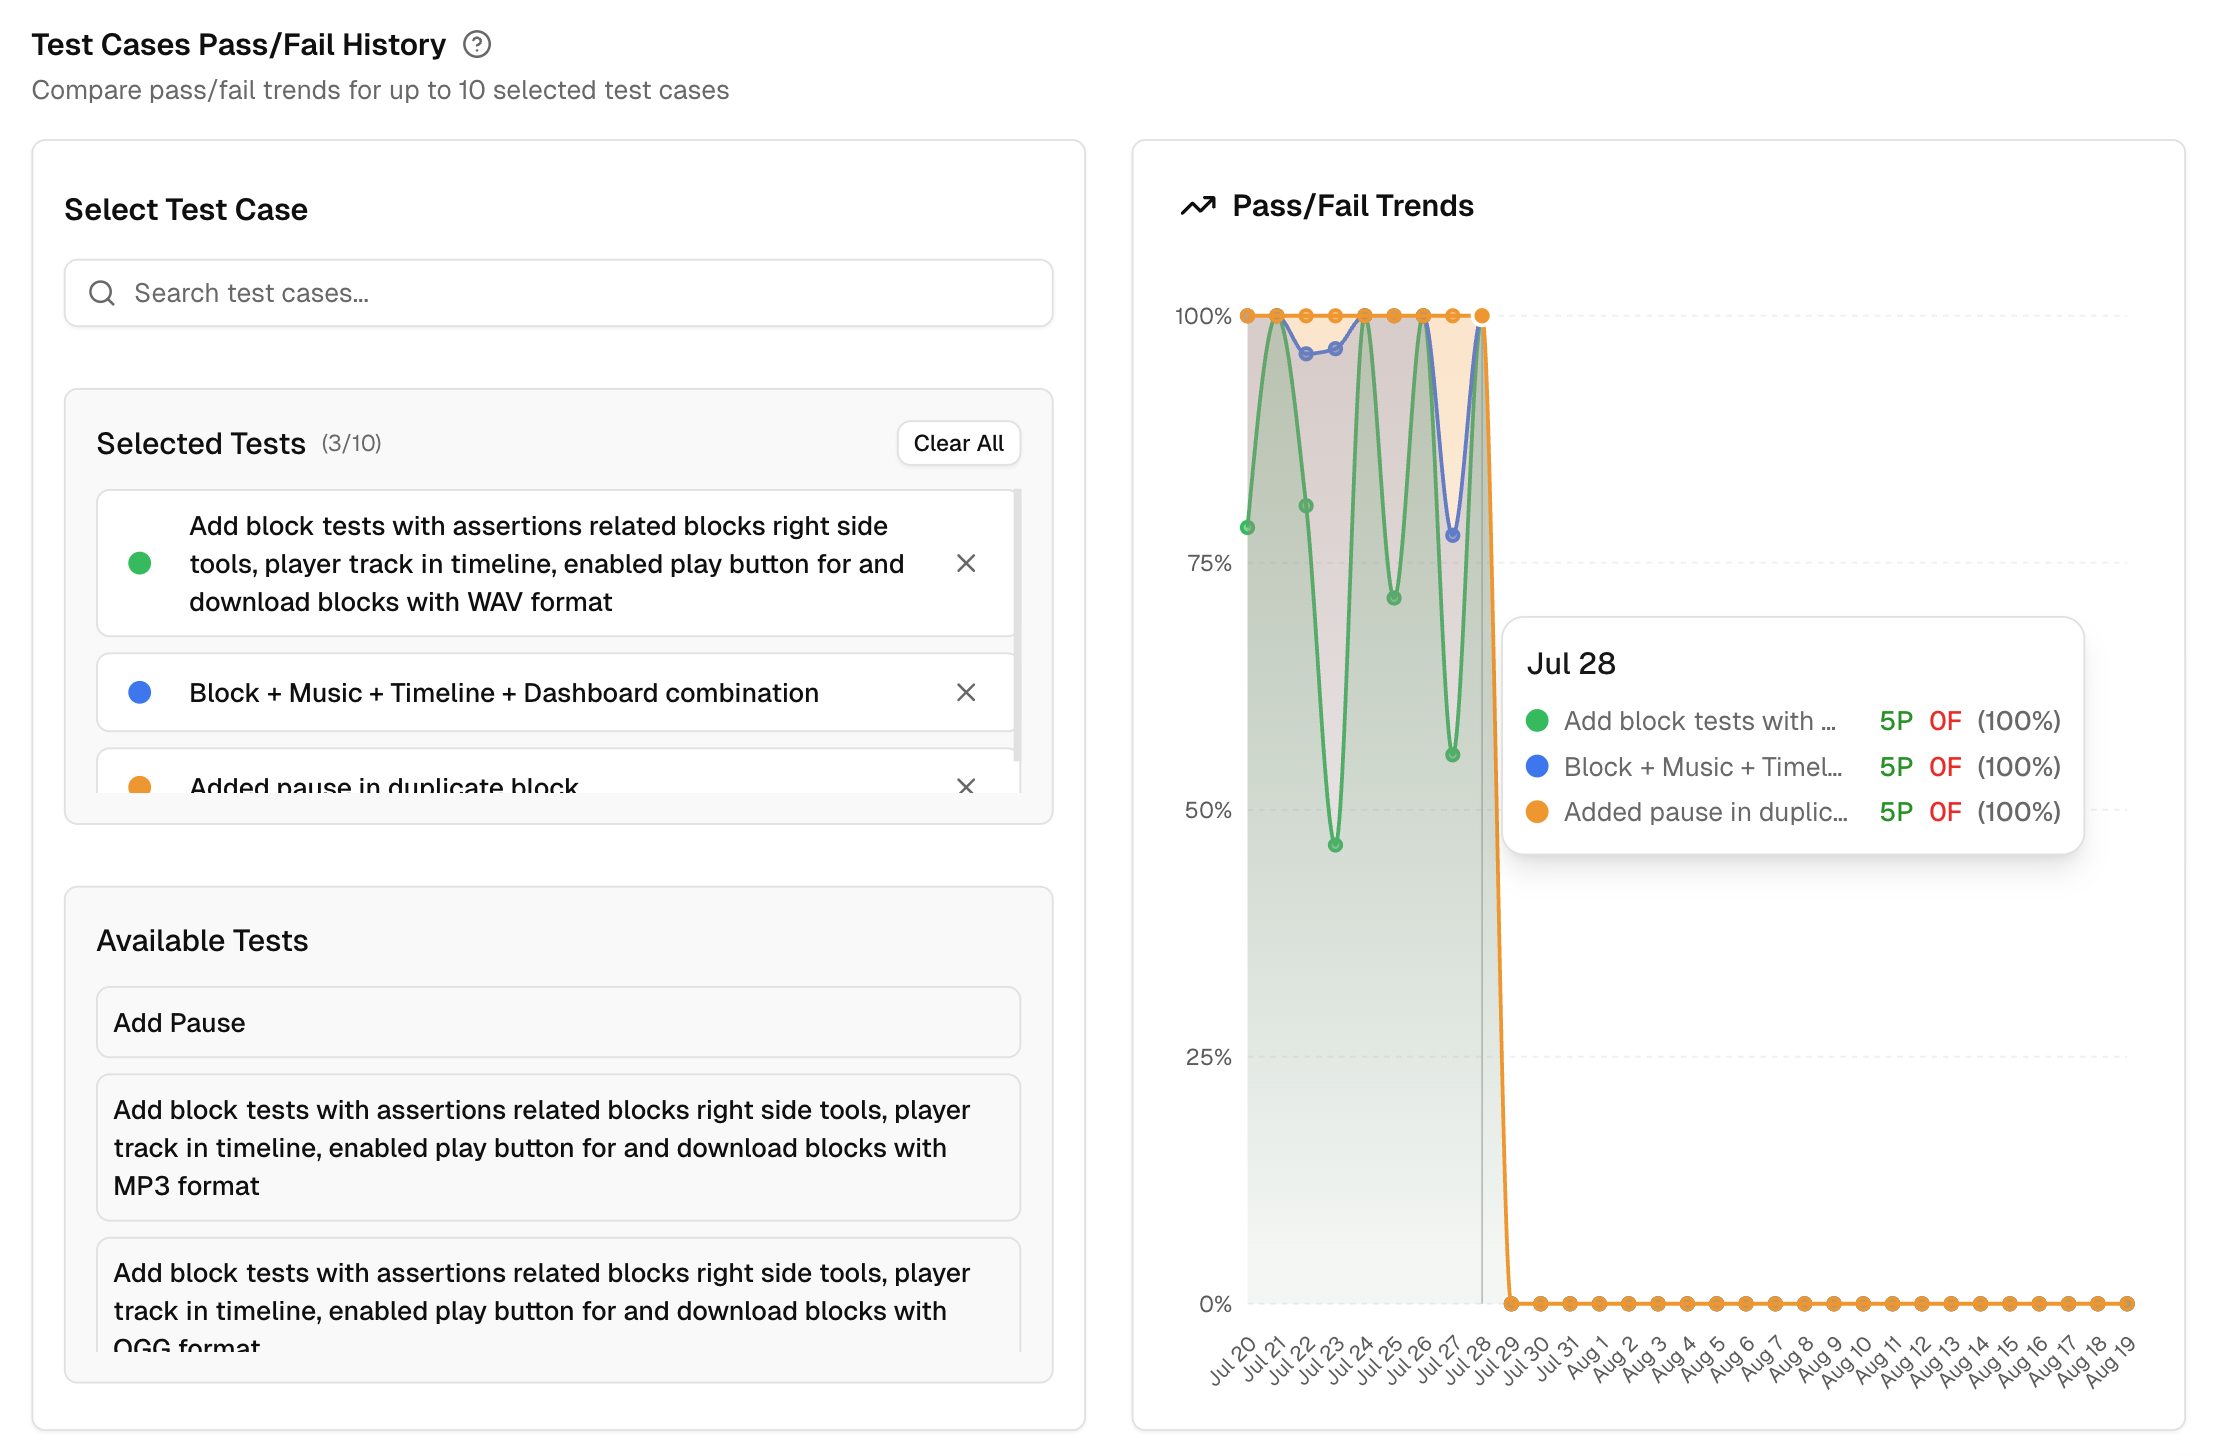
This tool lets you compare pass and fail trends for up to 10 test cases at the same time. It answers three common questions: which tests are unstable, did a fix actually stick, and where should we focus next.
-
Search and select test cases
Use the search bar to find tests by name. The Available Tests list is filtered by the environment and branches you selected. Choose up to 10. Selected tests appear in their own list, and you can remove any with one click. There is a Clear All control to reset the selection. -
See trends at a glance
The chart plots a daily trend for the selected tests, expressed as pass or fail for each day in the chosen period. You get a compact timeline that shows stability over time. -
Hover for details
Move your cursor over any day to see a tooltip with each selected test and its pass or fail state for that date. This makes it easy to spot the day a test started failing, or the day a fix took effect. -
Compare up to 10 tests
Selecting more than one test lets you spot shared drops or spikes. If several tests dip at the same time, you likely have a shared cause, such as a dependency change or an environment issue. -
Verify fixes
Add the tests you worked on and check that the line has been stable since the fix date. If the trend still shows fails, you know to dig deeper. -
Guardrail for releases
Before you ship, select the top critical tests and scan the last 7 or 14 days. A clean pass trend across those tests is a strong signal to proceed.
If a test is missing, widen the time range or switch branches. The list only shows tests that ran in your selection.
7. Test Execution Performance
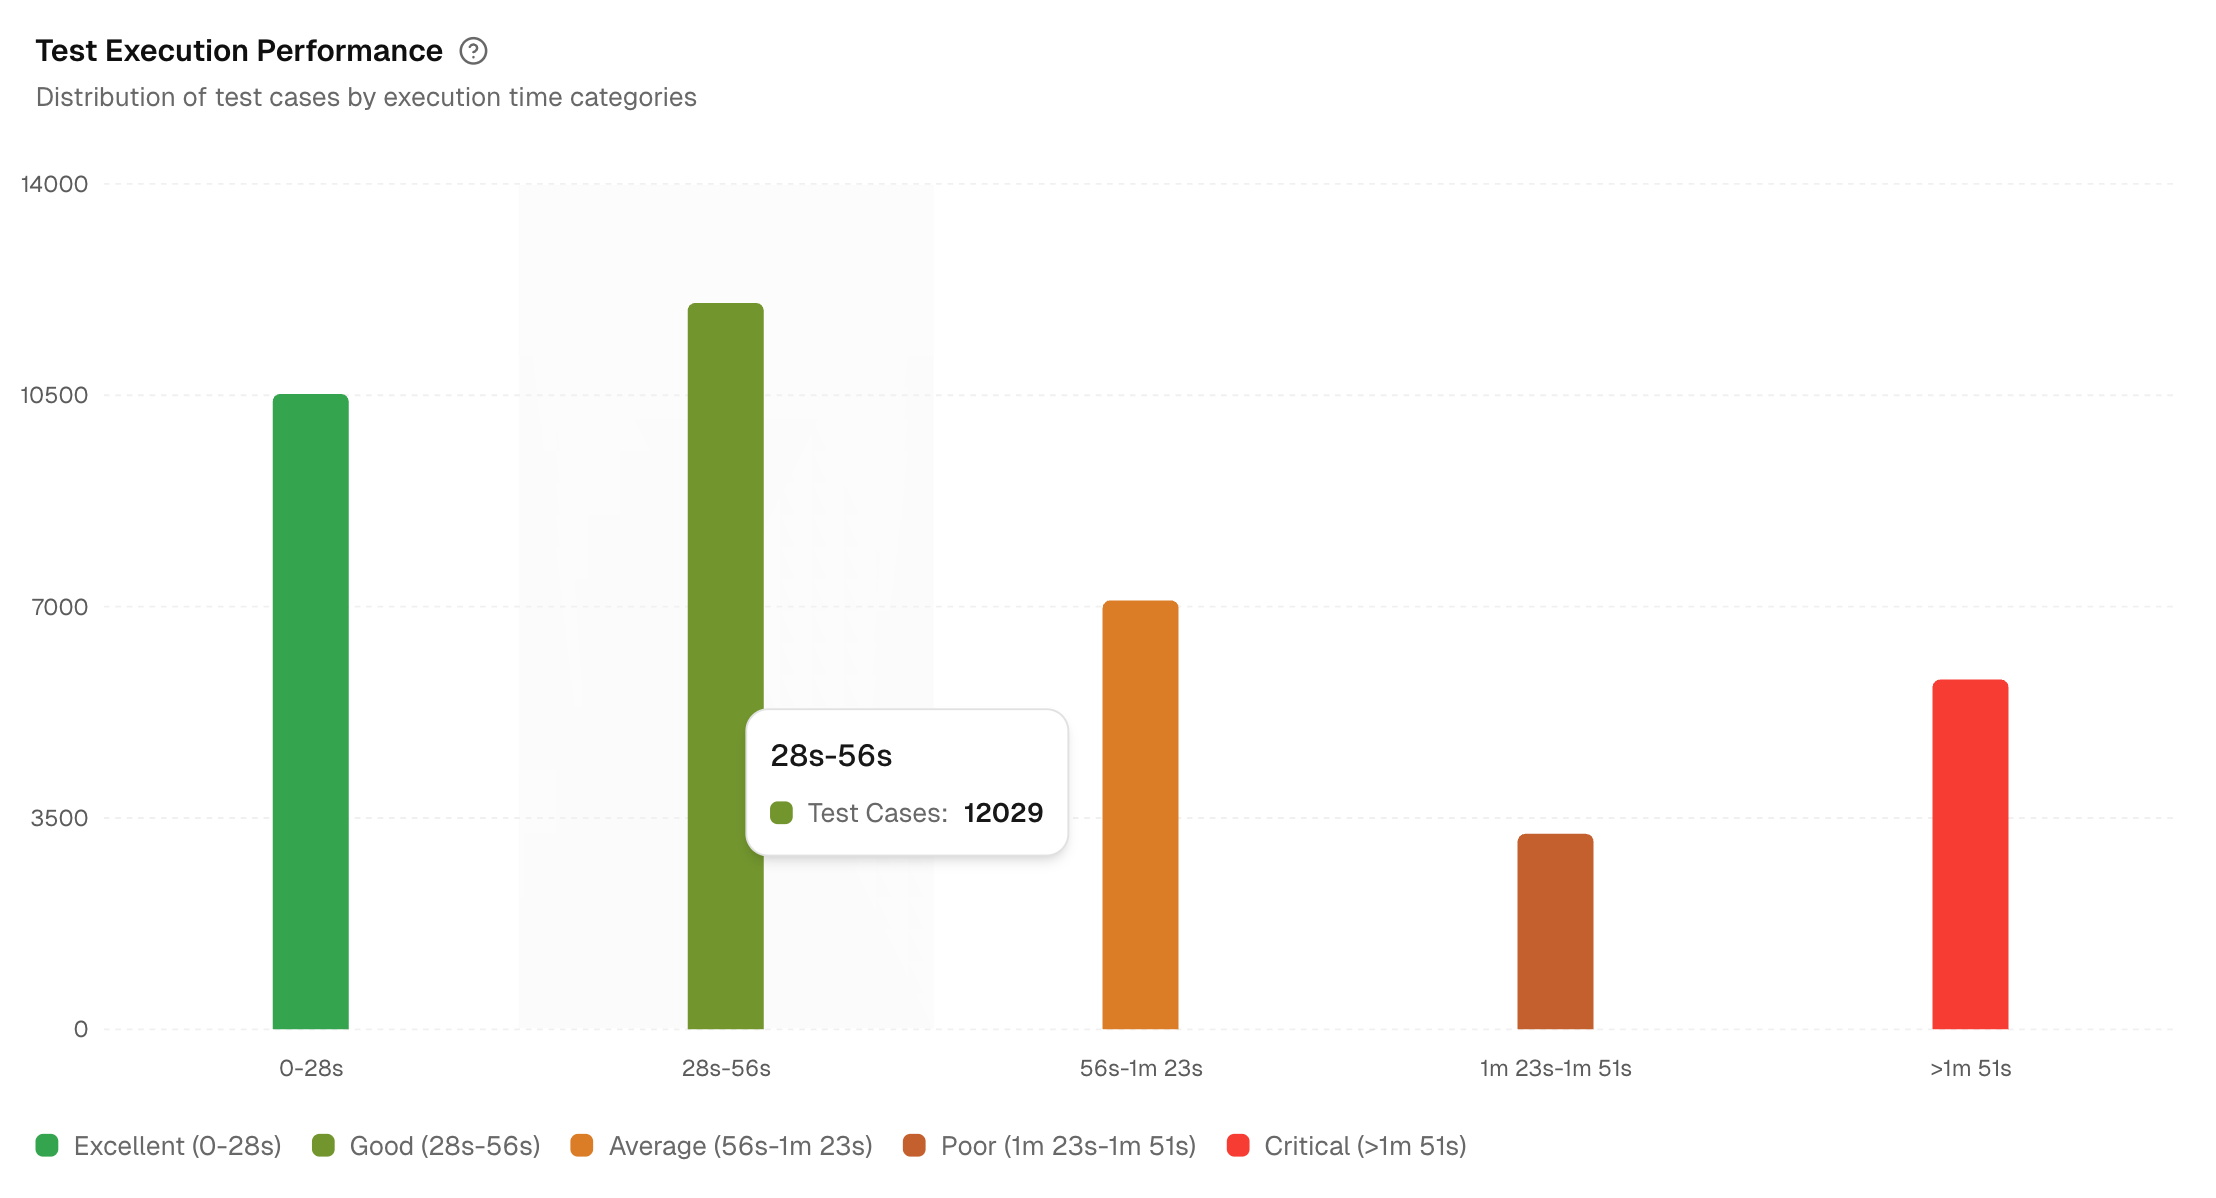
Shows the distribution of test cases by duration buckets across selected environments. If staging looks slower than dev, check data seeding, network limits, or container sizing.
8. Test Case Status Heatmap
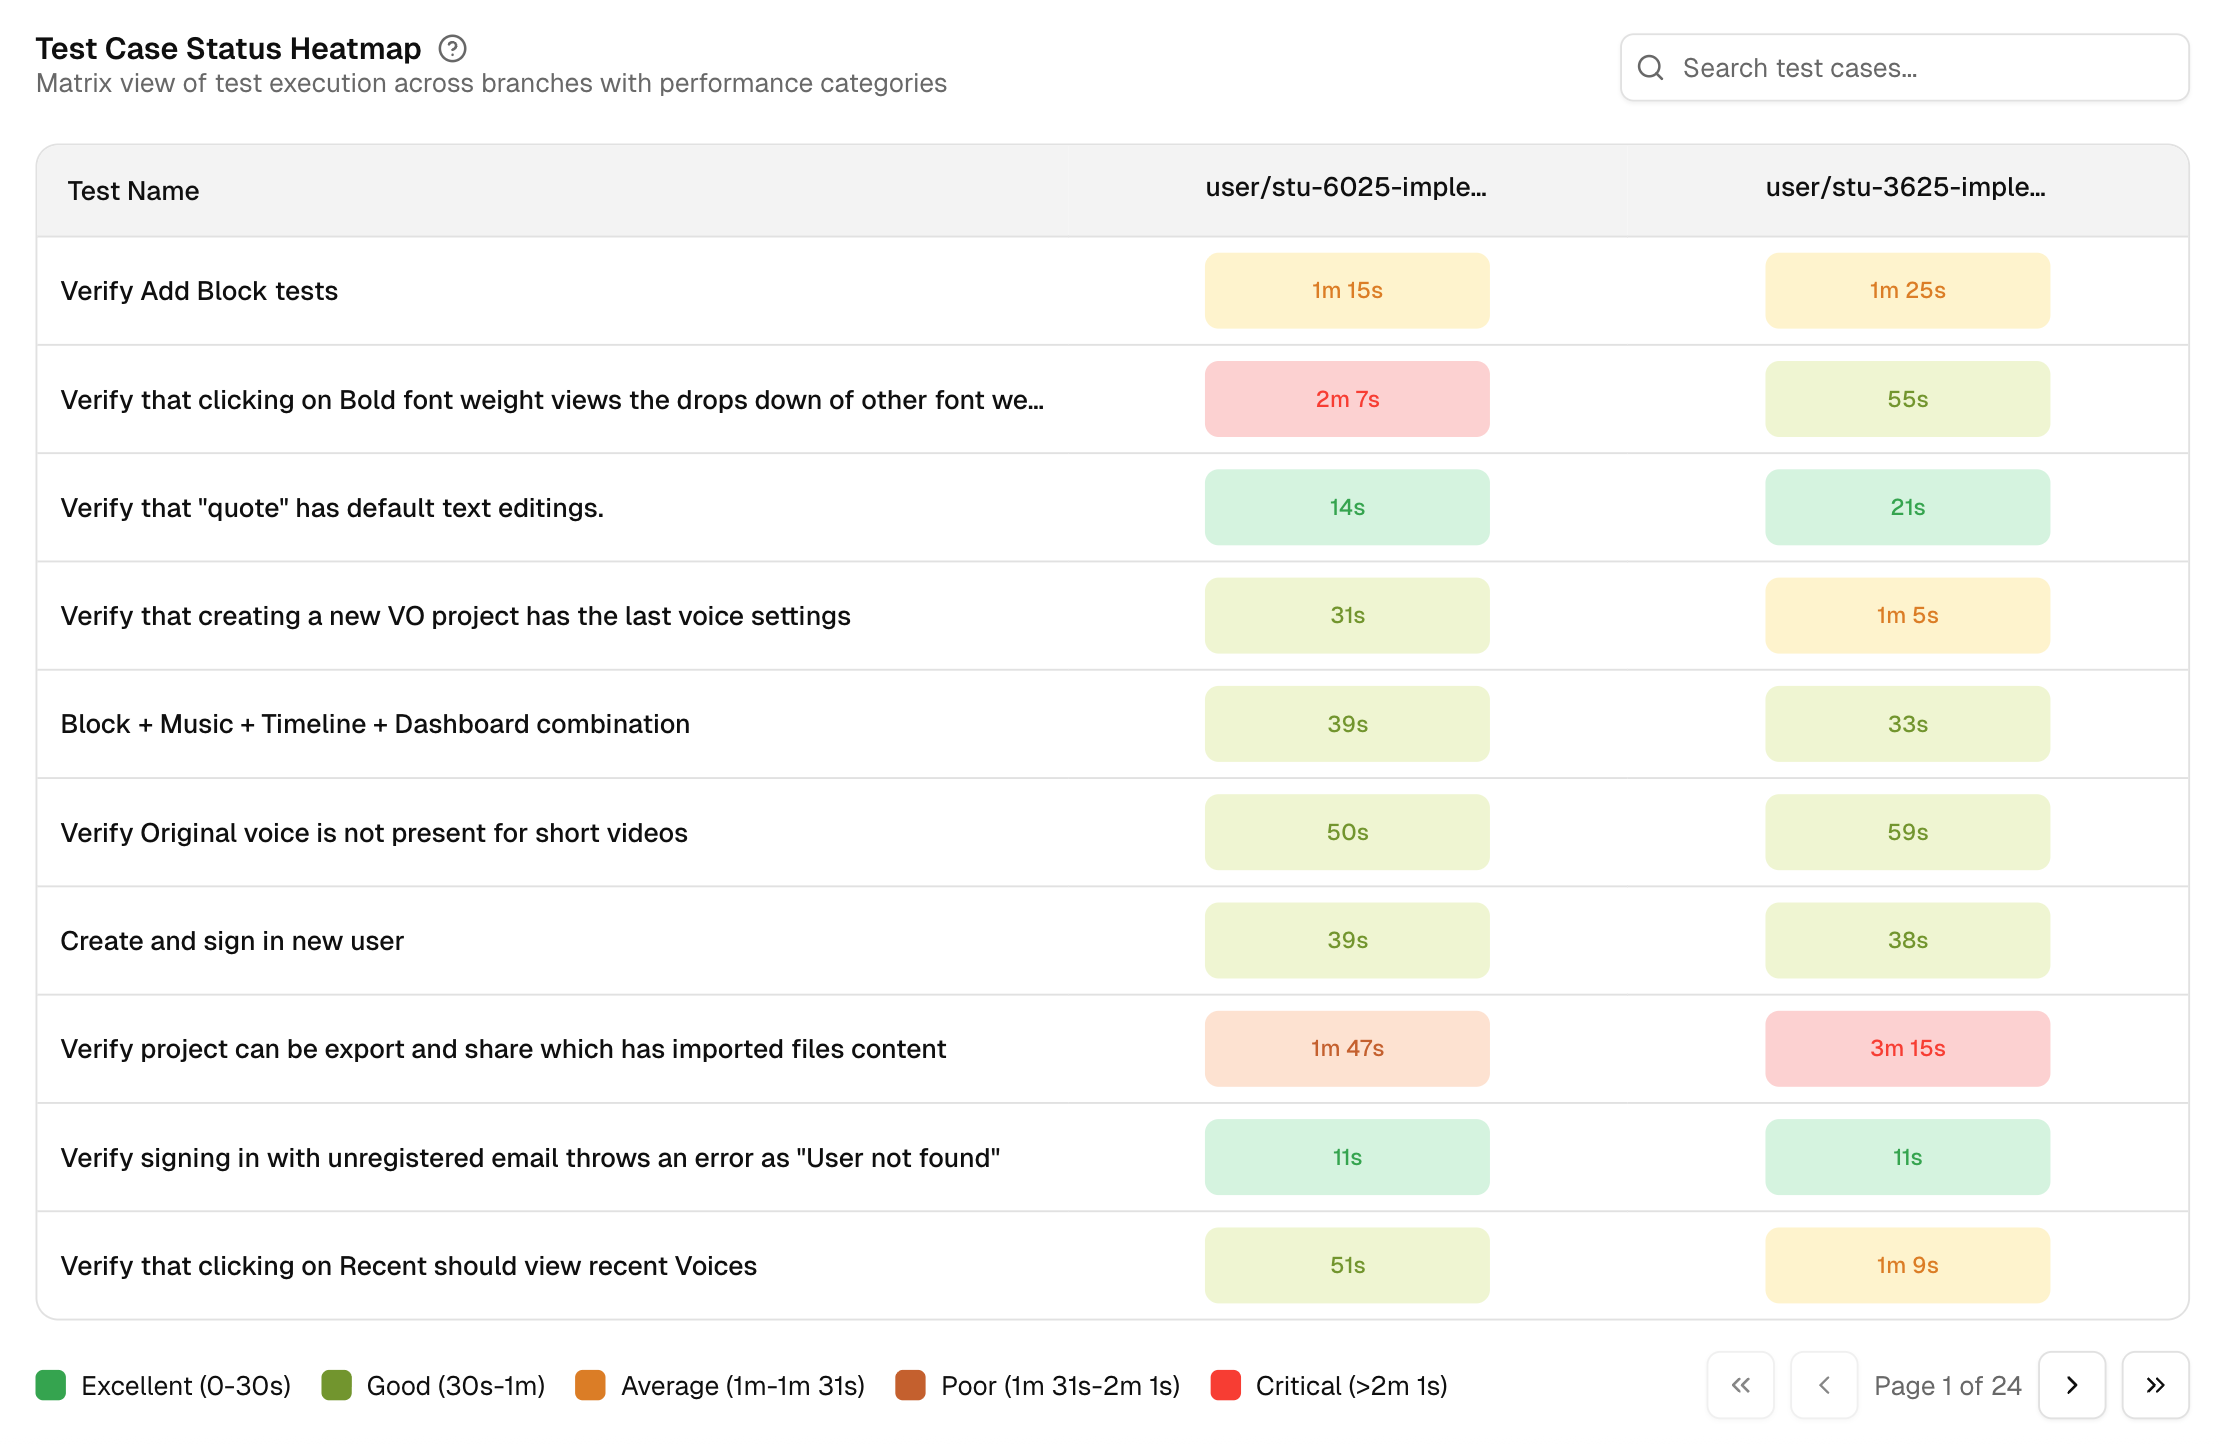
A matrix across branches with performance labels based on time: Excellent, Good, Average, Poor, or Critical. It flags hot spots at a glance. Click any critical cell to open the run and inspect steps, screenshots, and console output.
Pair the Heatmap with Speed of Branch Performance to confirm if a slow branch is driven by a few heavy tests.