Test Run
1. Average Run Time
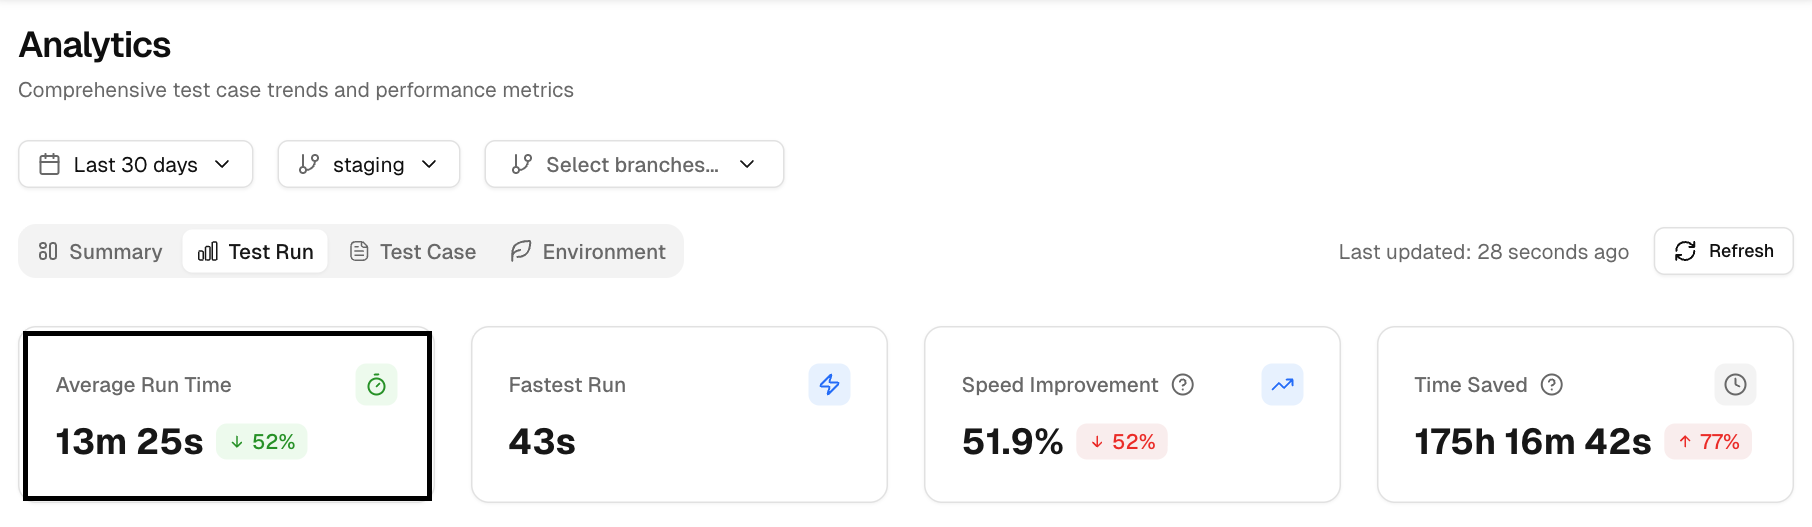
This shows the average time it takes for tests to complete during the selected time range.
Monitoring this helps you track how long your test suite takes to run over time. An increase in run time might signal inefficiencies or bottlenecks in the tests.
2. Fastest Run
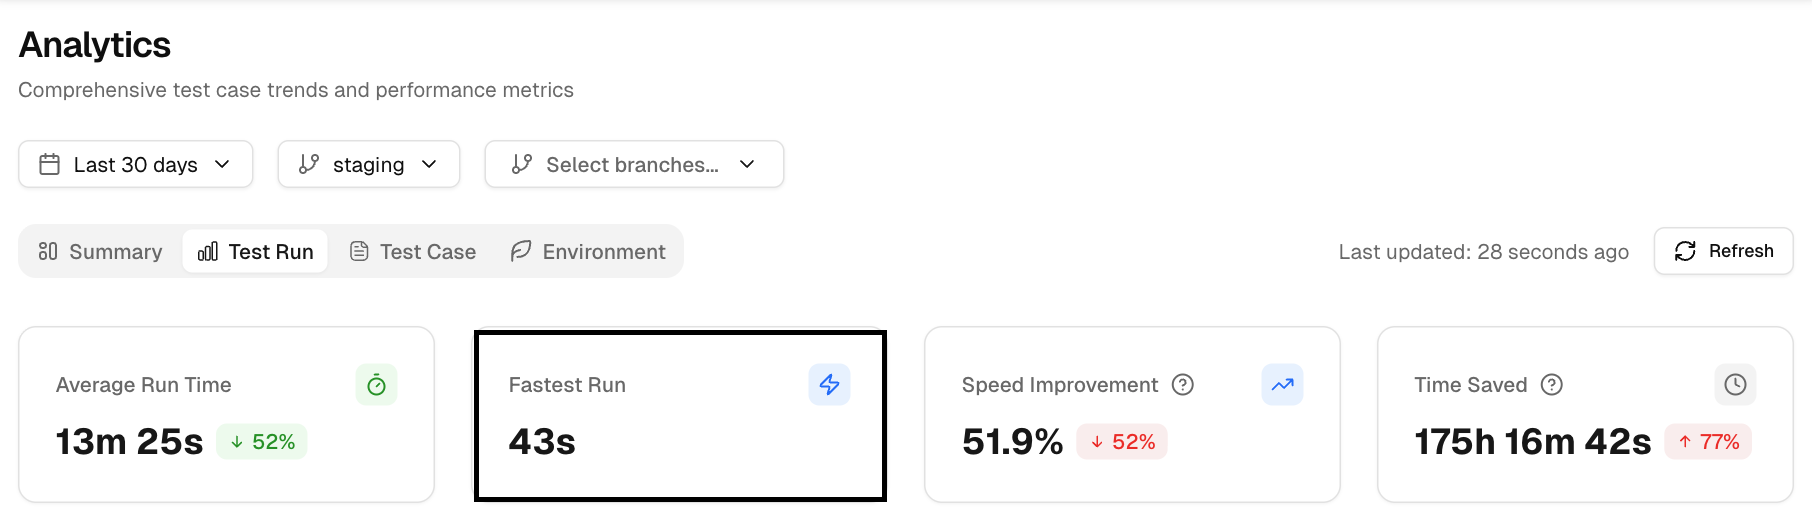
This graph shows the shortest run time for tests, providing an idea of the best-case scenario.
Identifying the fastest runs can help you benchmark your tests and look for areas where optimization is possible.
3. Speed Improvement
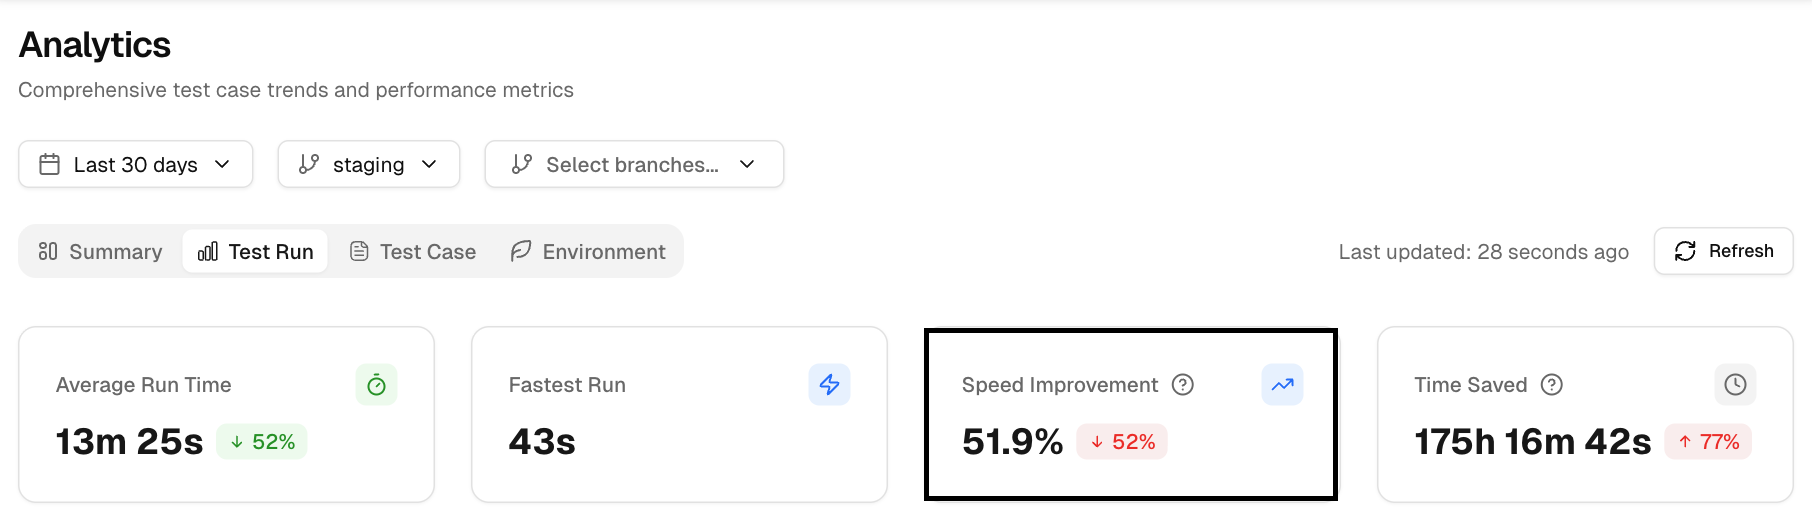
This metric shows the percentage decrease in run time compared to the previous period.
If your team is focused on speeding up tests, this metric tracks the improvements made over time.
4. Time Saved
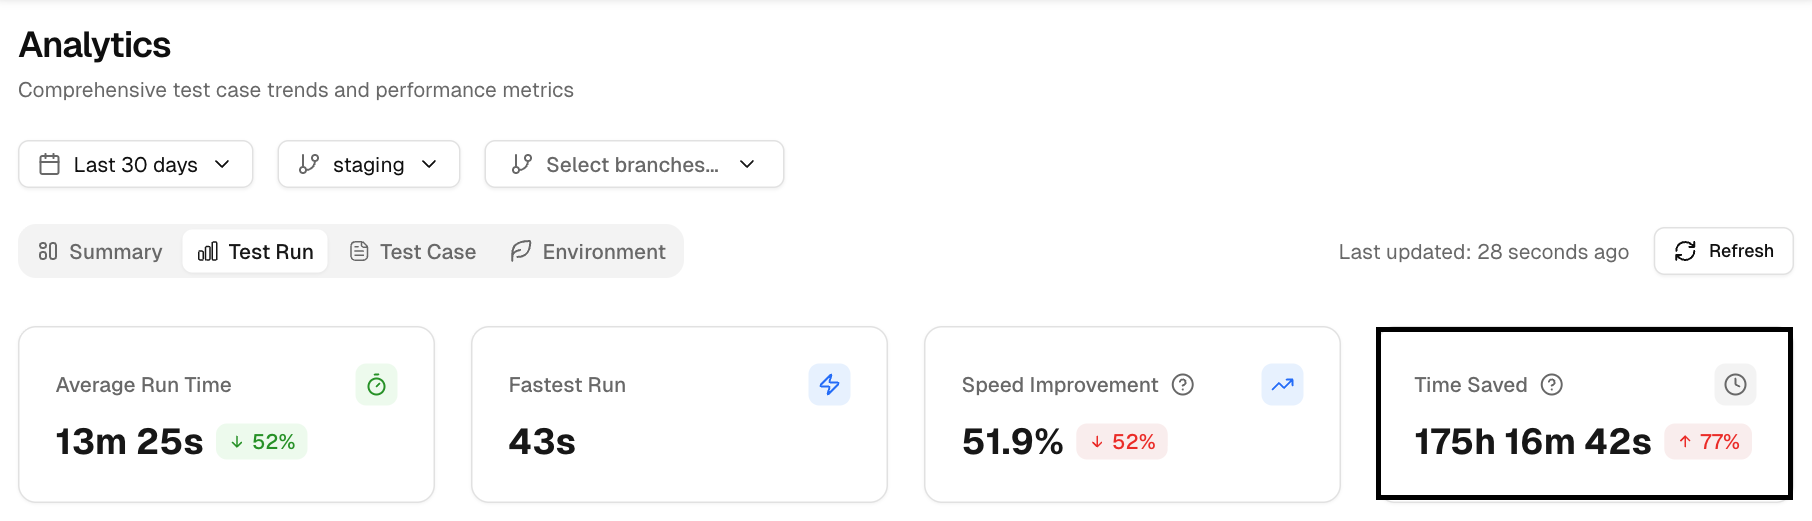
This shows the total amount of time saved due to speed improvements made in the test suite compared to previous runs.
It directly highlights the impact of optimizations and helps you understand the efficiency gains your team has achieved.
Use the same time range each week so the improvement % stays comparable.
5. Speed of Branch Performance
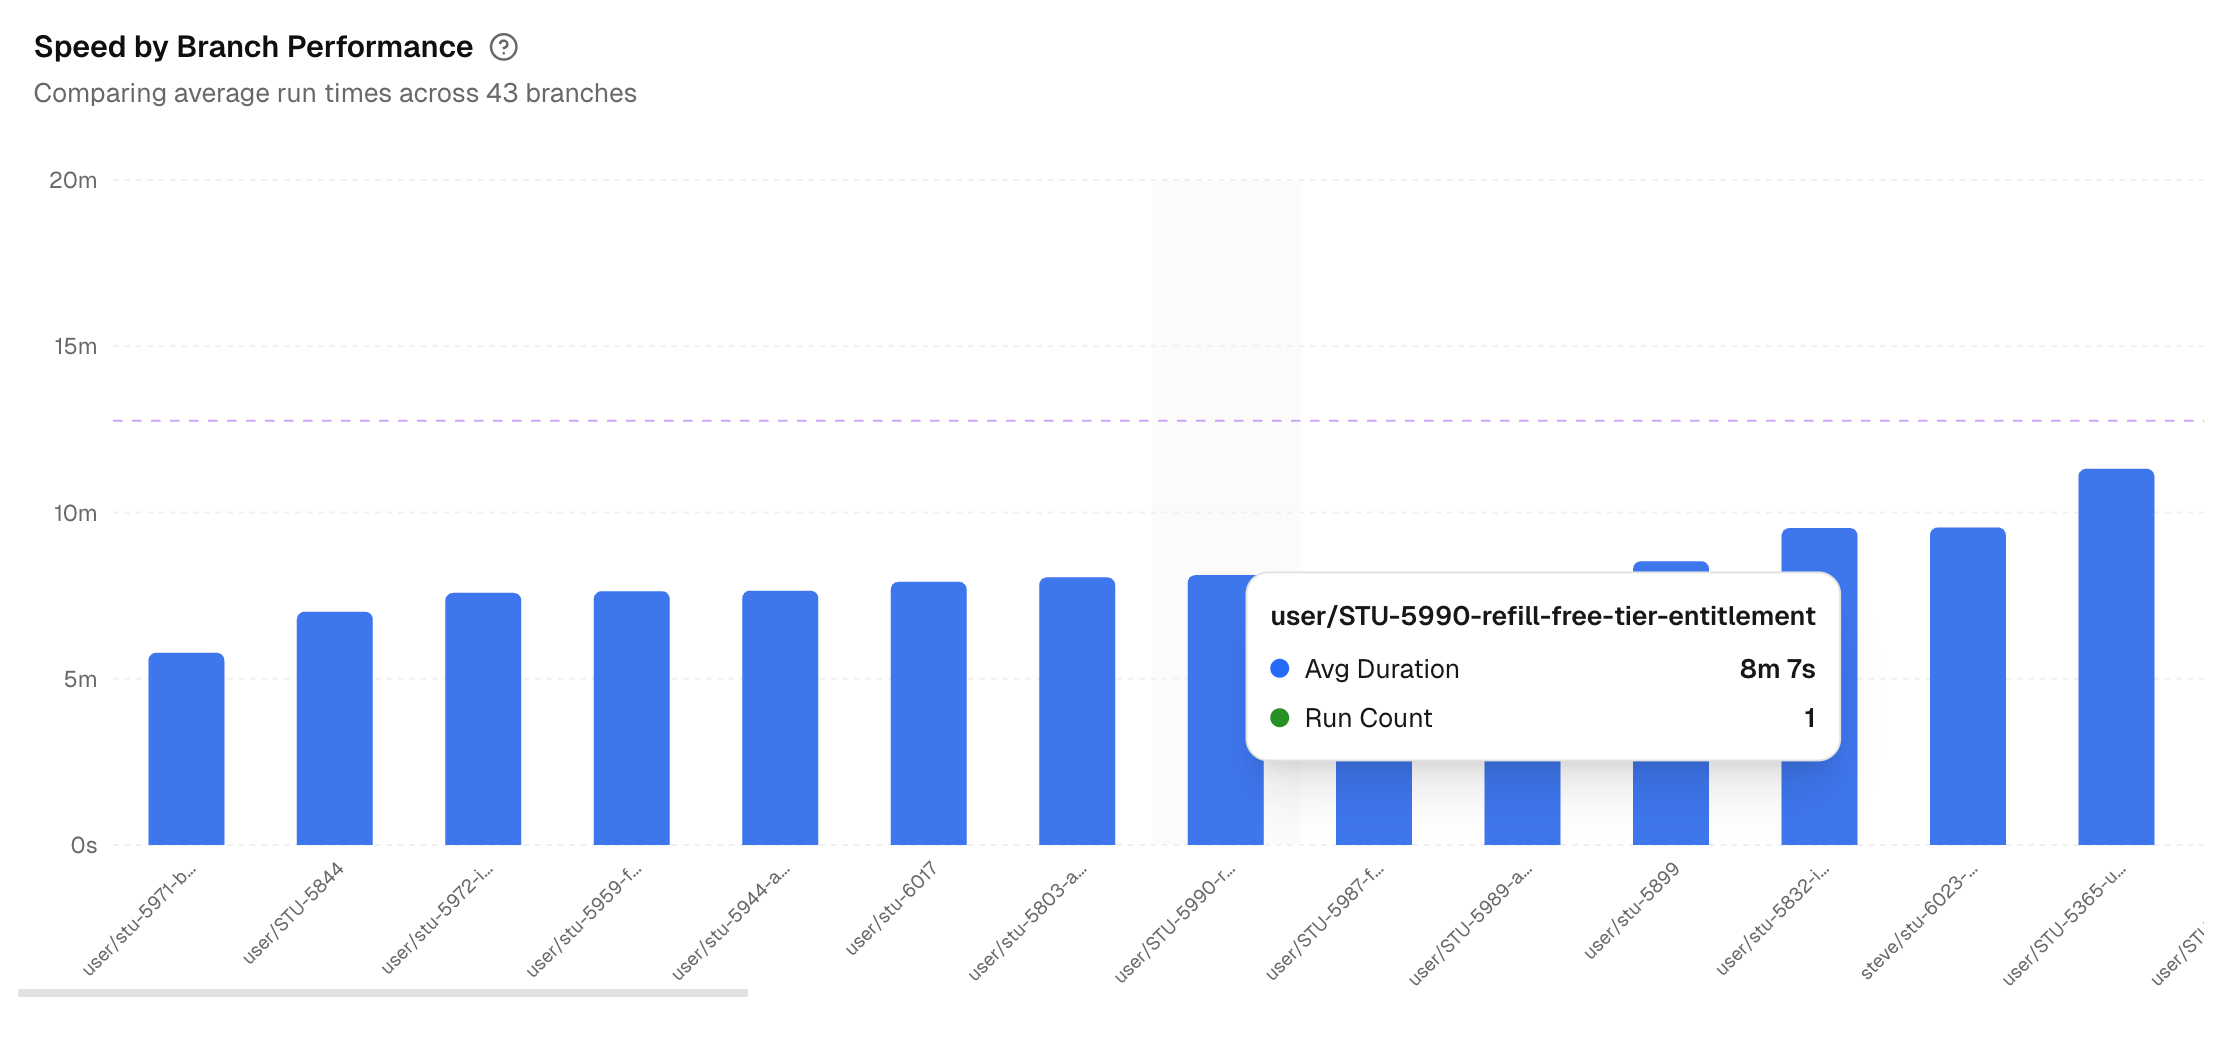
This graph compares the average run time across different branches in the selected environment.
This helps developers understand which branches are performing faster or slower, helping them identify issues that might be affecting the test suite's speed.
If one branch is slow, compare its container size and data seeding with main.
6. Test Execution Efficiency Trends
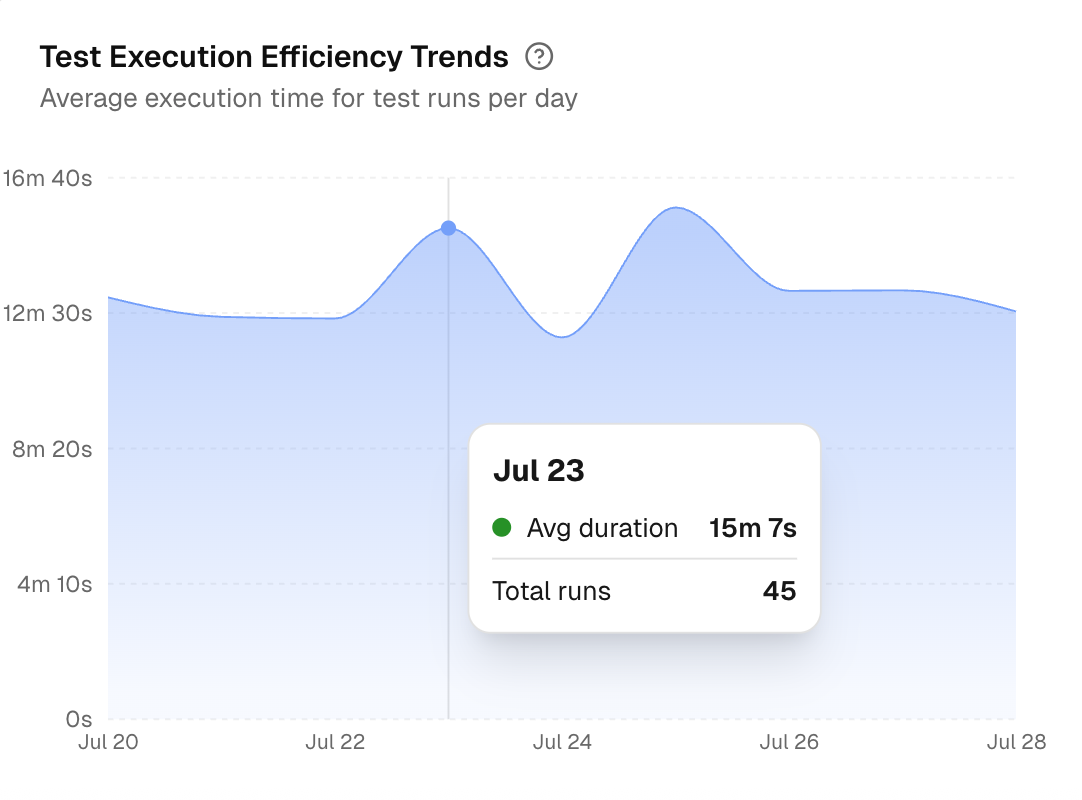
This chart shows the average run time of tests per day. By tracking test execution efficiency over time, you can spot any gradual increases in test execution time and take steps to improve performance.
7. Test Run Speed Distribution
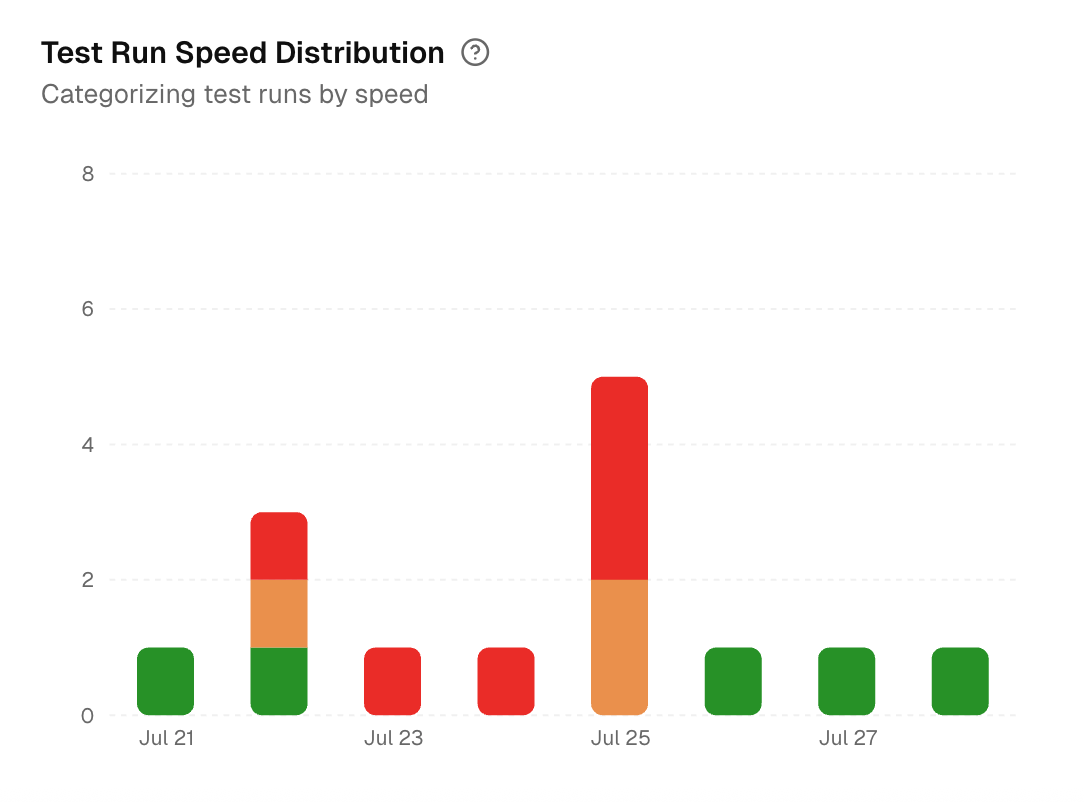
This graph categorizes your tests into fast, normal, and slow groups.
This allows you to see how many tests are slowing down your pipeline and focus on optimizing those slow tests.