Developer Dashboard
The Developer Dashboard is designed to help developers keep track of active blockers, PR readiness, and flaky tests.
Why This is Beneficial
Testdino’s Developer Dashboard integrates with your development workflow to make testing part of your regular coding process. Unlike traditional testing tools,
Testdino’s flaky test detection and branch health tracking provide developers with actionable insights, not just test results. This lets them identify and fix problems faster, without interrupting the development flow.
The tiles keep the signal short. The panels give the path to action: PRs to merge, blockers to fix, and flaky tests to clean up.
Key Metrics
1. Active Blockers
- KPI tile: shows the count of blockers in the current filters. One glance tells you if shipping is at risk.
- Detail panel: Shows you the Issues preventing code from shipping. And lists each blocker with env, recent failure rate, and priority. Click to open the linked PR or failing run and start triage.
2. Ready to Ship
-
KPI tile: count of PRs that pass all checks for your selection. It answers “what can we merge today.”
-
Detail panel: shows the PRs ready for review with pass ratios and a Merge action. Sort by recency to move the cleanest work first.
3. Flaky Tests Alert
- KPI tile: number of tests detected as flaky for the selected time, env, and branches. This signal is computed by Testdino from recent runs. A quick noise barometer.
- Detail panel: Shows the tests that are failing intermittently and need attention. And lists the flaky tests with file path, recent occurrences, and failure rate. Open the test case to see a detailed view.
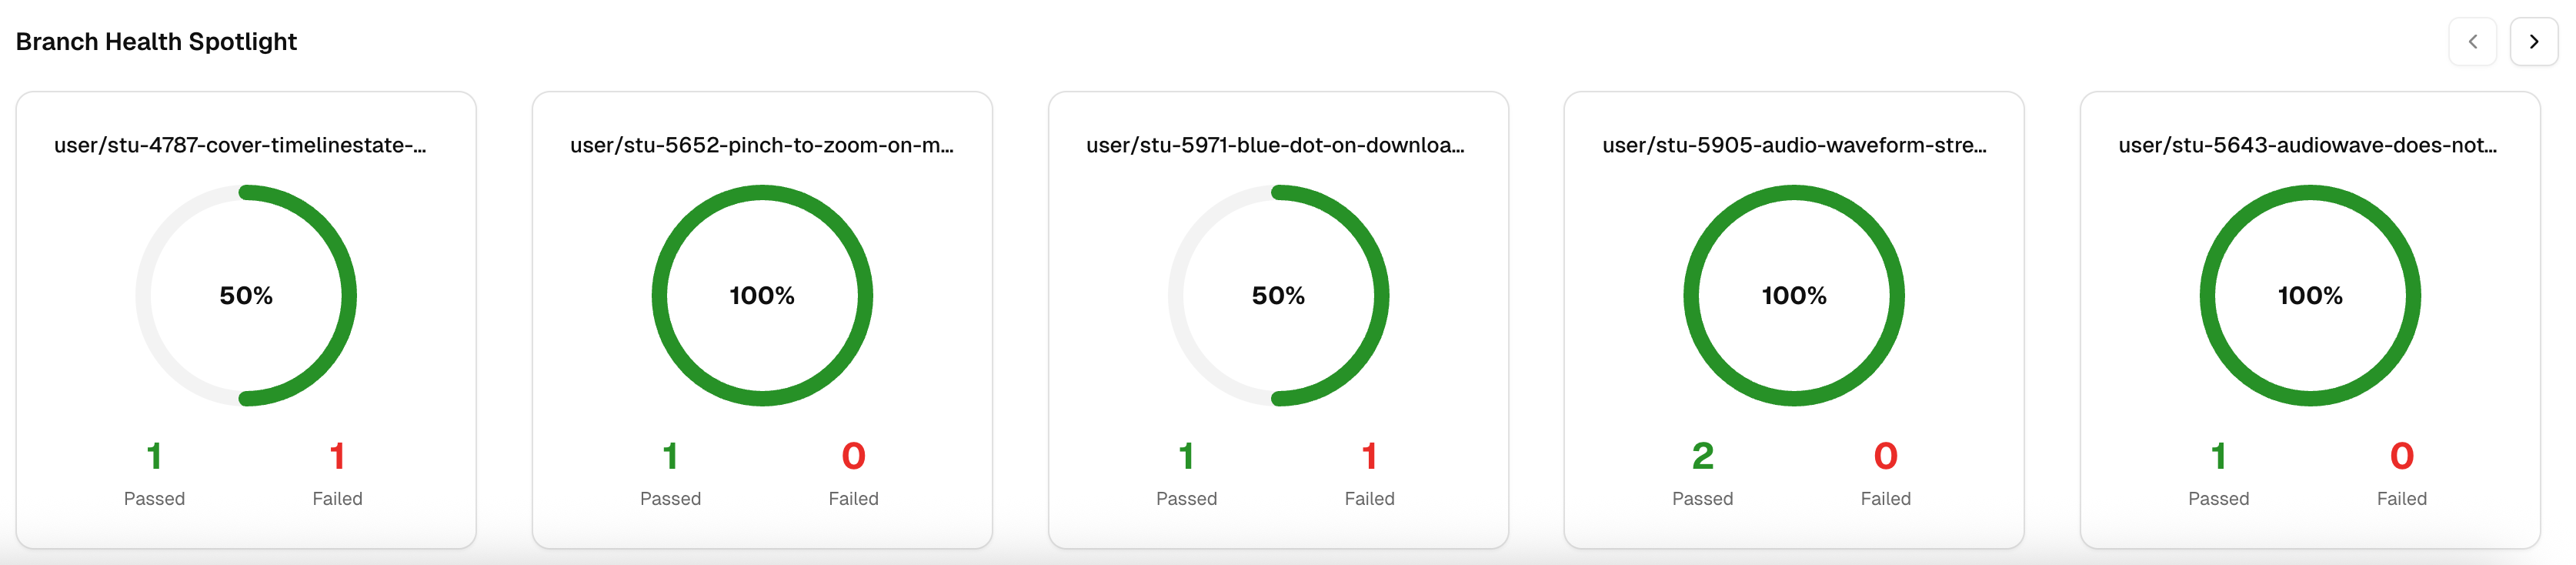
4. Branch Health Spotlight
Highlights the health of the current branch by displaying the results of tests in that branch. Shows the pass rate and pass/fail counts for the focused branch. Good for a quick “is this branch safe.”