QA Dashboard
The QA Dashboard is designed to give Quality Assurance teams a comprehensive view of the project's test health. This includes critical metrics and AI-driven insights that can help identify issues faster.
Why This is Beneficial
Testdino understands that for QA engineers, efficiency is key. Testdino doesn’t just show test results; it highlights where the most critical issues lie and provides a quick path to resolving them.
With AI-powered failure categorization and flakiness tracking, QA teams can differentiate between real product bugs and test instability, reducing the time spent on false alarms.
Key Metrics
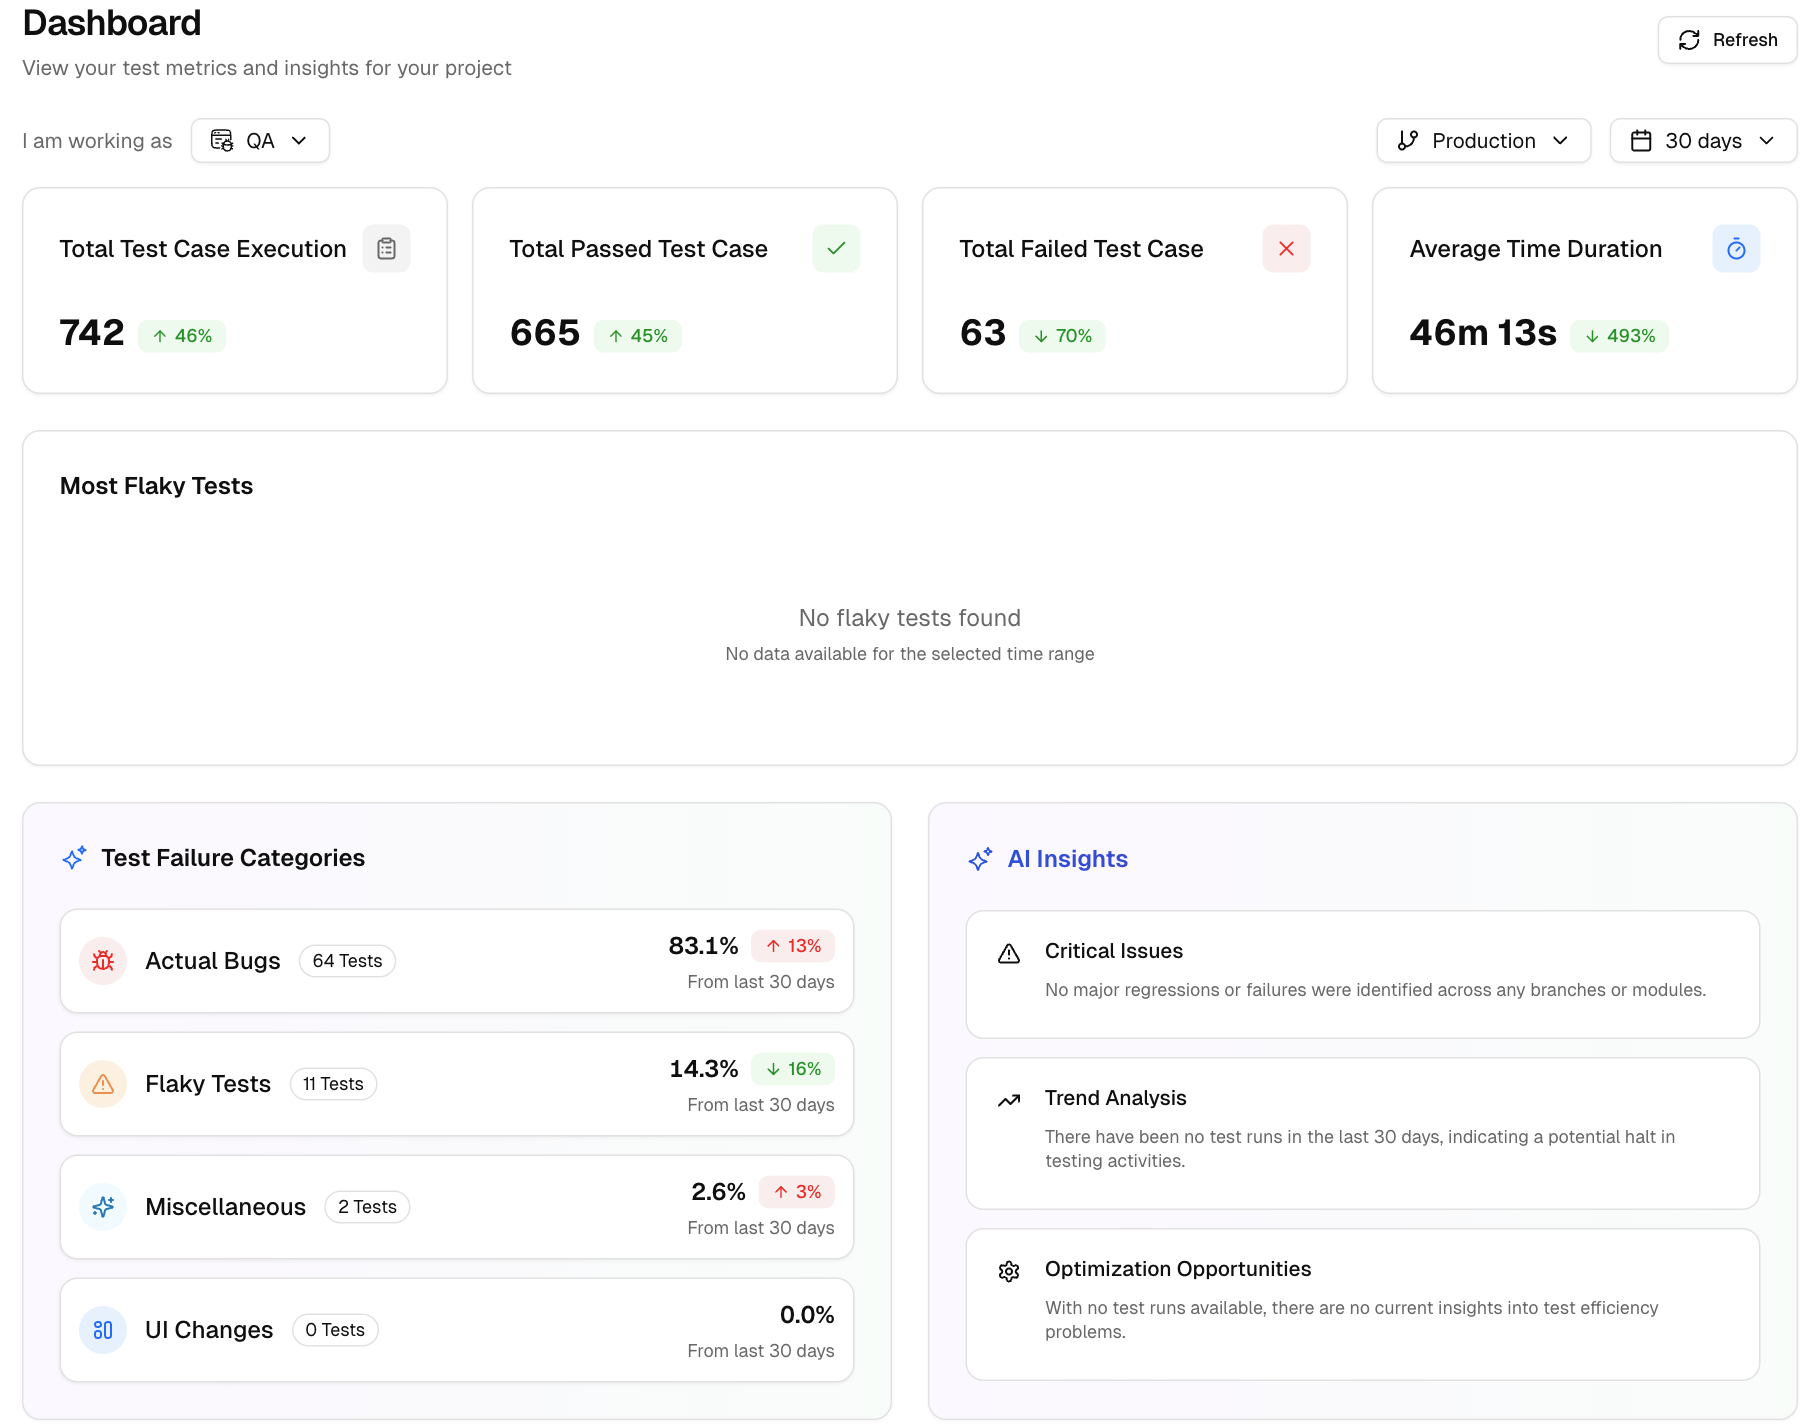
1. Total Test Case Execution
Displays the number of tests executed during the selected period. This will give you a quick understanding of the volume of testing done.
2. Total Passed Test Cases
The total count of tests that passed helps track test stability and reliability.
3. Total Failed Test Cases
Displays how many tests failed. This gives an immediate insight into areas that need attention.
4. Average Time Duration
The average duration of test executions allows QA to assess testing efficiency.
5. Most Flaky Tests
Identifies the tests that fail intermittently, highlighting tests that need further investigation to identify whether failures are due to issues in the code or unreliable test scripts.
6. Test Failure Categories
Breaks down failure categories like Flaky Tests, UI Changes, Actual Bugs, and Miscellaneous. And provides a deeper understanding of the nature of failures, helping QA teams prioritize their actions.
-
Flaky Tests: Intermittent failures from timing, race, order, shared state, or network. Often passes on retry or only fails in CI.
-
UI Changes: DOM or selector changes break interactions. You’ll see “locator not found,” timeouts, or text mismatches after UI updates.
-
Actual Bugs: Real product defects. Assertions fail consistently across runs or environments and need a code fix.
-
Miscellaneous: Non-product issues like setup or script errors, env misconfig, missing data/credentials, CI problems, or external service downtime.
AI Insights
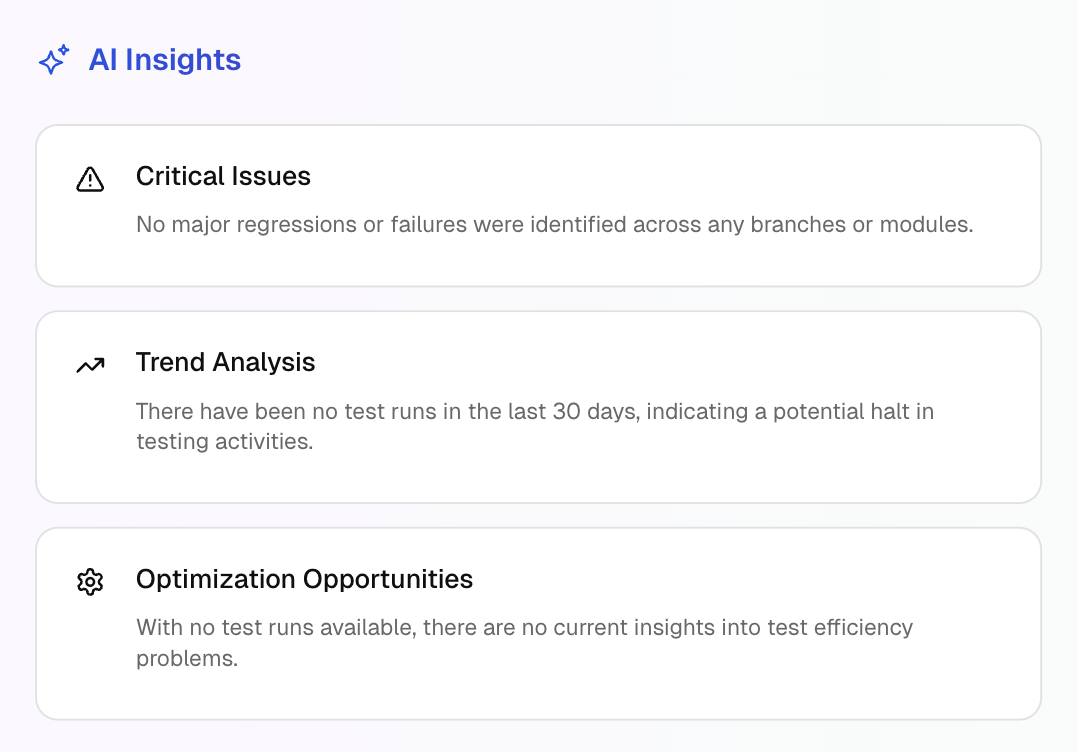
1. Critical Issues
AI identifies major issues affecting test stability. Helps QA teams focus on the most important issues first.
2. Trend Analysis
AI tracks and predicts trends in test results. Allows QA teams to understand test stability over time.
3. Optimization Opportunities
AI suggests improvements for test execution and stability. Provides actionable insights for improving testing efficiency.
Cross-Environment Performance
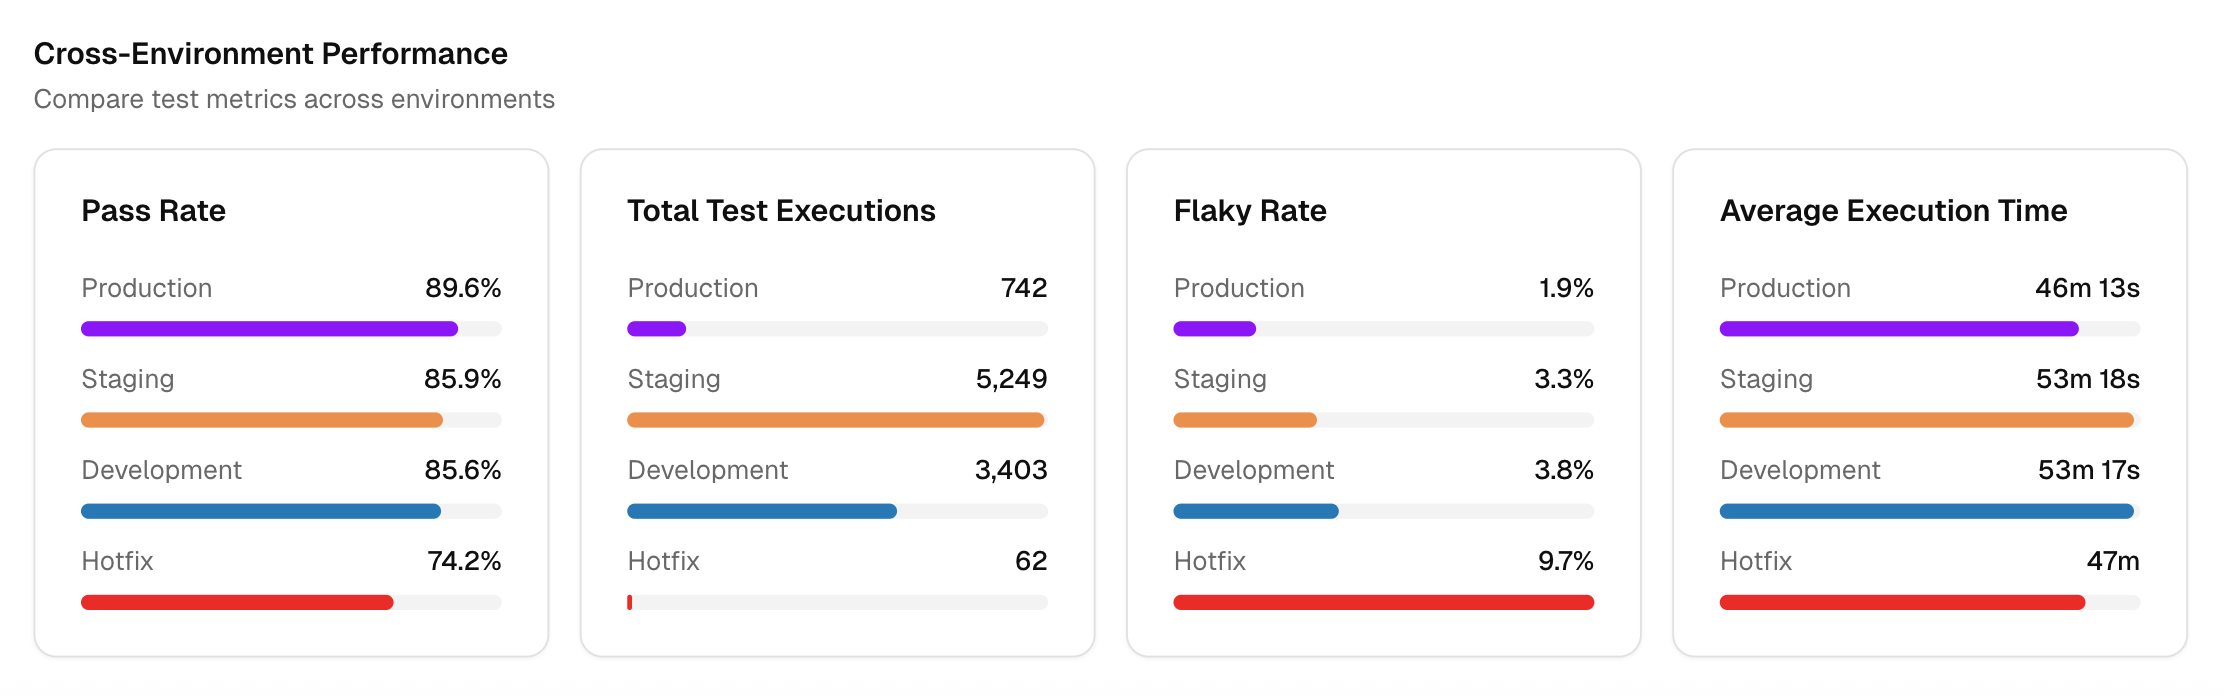
QA teams can compare the performance of tests across various environments (like Prod, Stage, QA, Dev, etc.) to ensure consistency.
1. Pass Rate
Shows the pass rate of tests across different environments.
Why it matters: Helps identify if certain environments are causing failures.
2. Total Test Executions
Displays the number of tests run per environment. Provides a deeper view into how tests perform in different environments.
3. Flaky Rate
Measures the flaky tests in each environment. Allows you to focus on unreliable tests in specific environments.
4. Average Execution Time
Shows the average execution time for tests in different environments. A crucial metric for optimizing testing time.