History
The History tab highlights trends across recent builds. It shows run outcomes in a stacked chart and execution times in a bar chart, with alerts for spikes in flakiness or runtime changes to spot instability or environment issues.
1. Run History chart
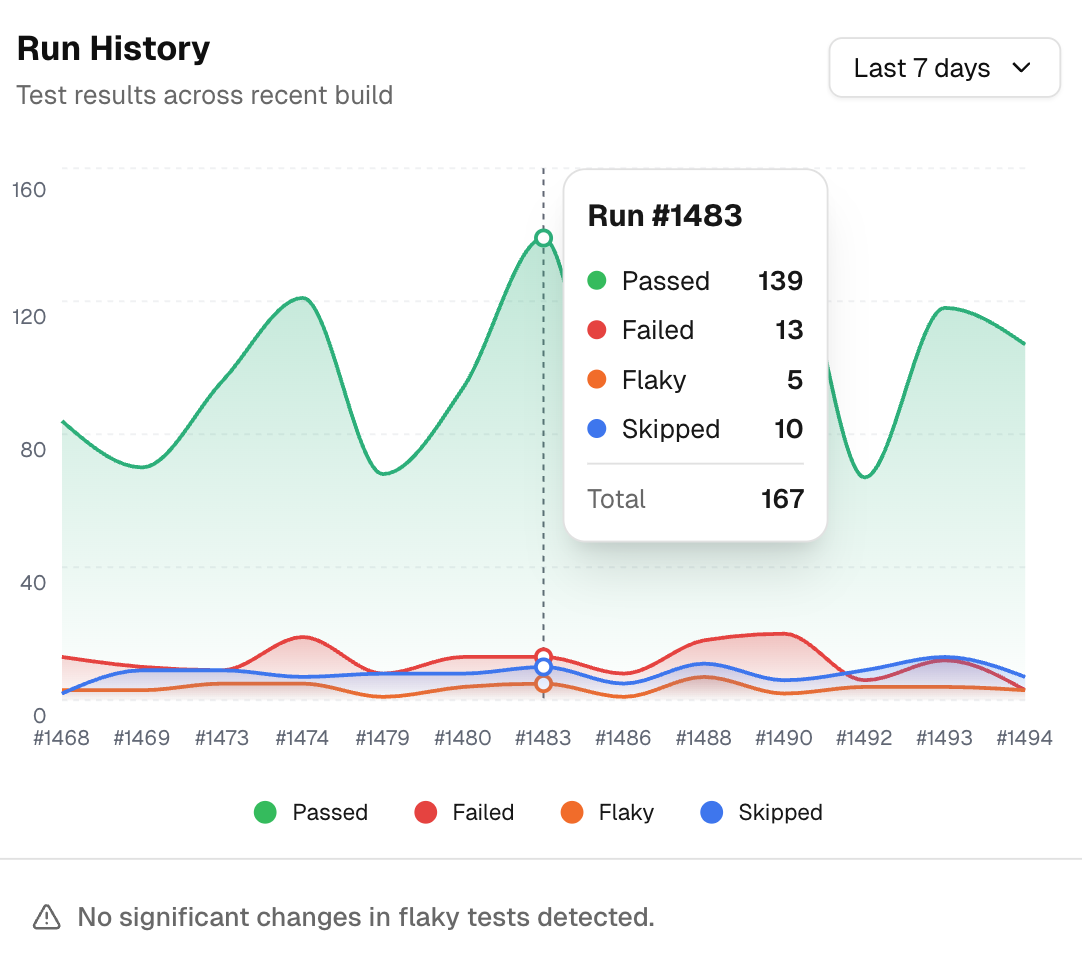
A stacked area chart for Passed, Failed, Flaky, and Skipped across the selected period. Tooltips show the exact breakdown at any build.
A note under the chart flags a significant change in flaky tests when the flaky share departs from the recent baseline by a meaningful amount across more than one build.
The chart shows the historical data for the branch in which the selcted test run has ran.
2. Test Execution Time chart
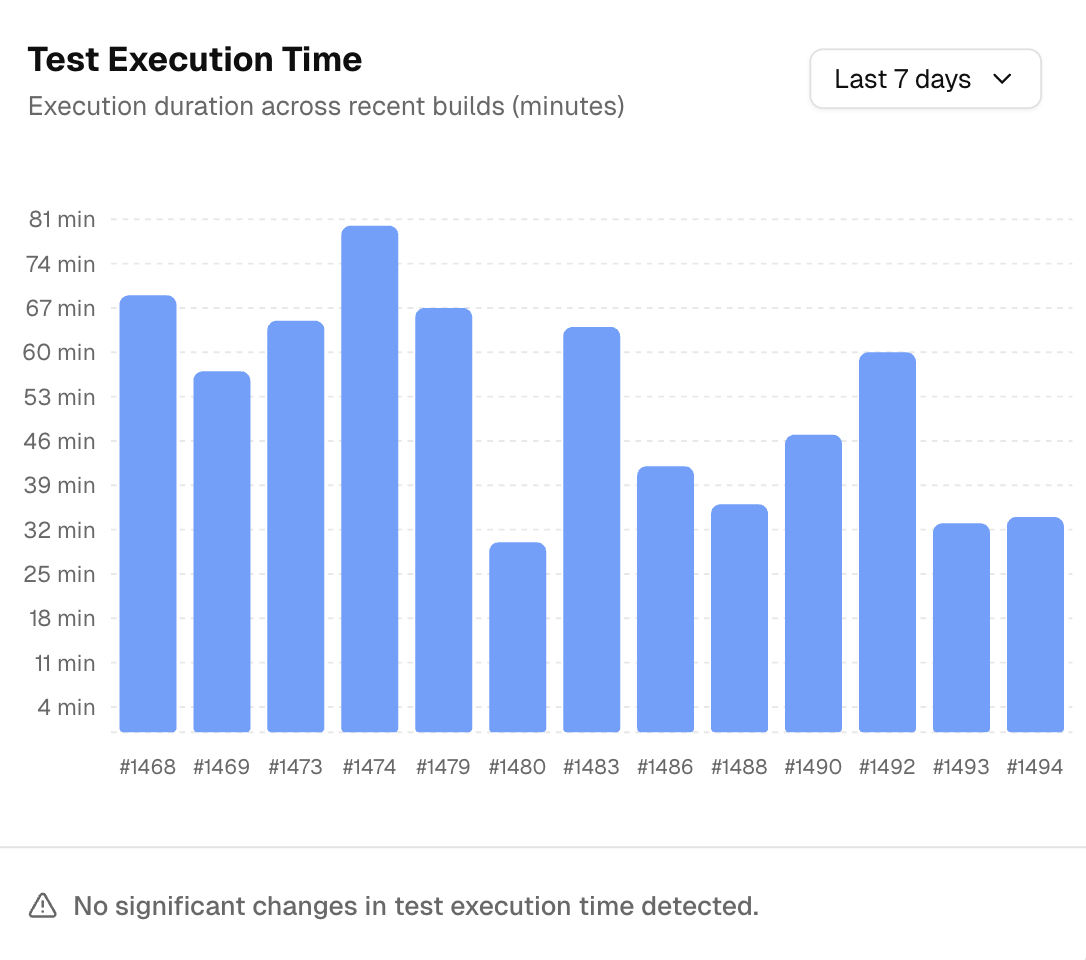
A bar chart of total runtime for each recent build. A note flags a significant change in execution time when the duration departs from the recent average by a clear margin for the selected period.
A flaky spike without a runtime change points to instability. A runtime jump with steady outcomes points to environment or data changes.