> ## Documentation Index
> Fetch the complete documentation index at: https://docs.testdino.com/llms.txt
> Use this file to discover all available pages before exploring further.
# Debug Playwright Test Failures
> Debug failures with traces, screenshots, error grouping, and AI analysis.
**What you'll learn**
* What evidence TestDino collects for each test execution
* How to use traces, screenshots, and videos to diagnose failures
* How AI classification and error grouping speed up triage
TestDino collects evidence from each test execution: screenshots, videos, traces, console logs, and error details. Understand failures without re-running tests locally.
## Evidence Types
| Evidence | What it shows | When to use | Guide |
| :------------ | :------------------------------------------ | :------------------------------------- | :------------------------------------------------------------------- |
| Screenshots | Visual state at failure point | UI layout issues, missing elements | [Visual Evidence](/guides/debug-playwright-failures/visual-evidence) |
| Video | Full test execution recording | Timing issues, unexpected interactions | [Visual Evidence](/guides/debug-playwright-failures/visual-evidence) |
| Trace | Step-by-step execution with network and DOM | Complex failures, race conditions | [Trace Viewer](/guides/playwright-trace-viewer) |
| Console | Browser console output | JavaScript errors, API failures | - |
| Error details | Error message and stack trace | Assertion failures, exceptions | [Error Grouping](/guides/playwright-error-grouping) |
## Where to Find Evidence
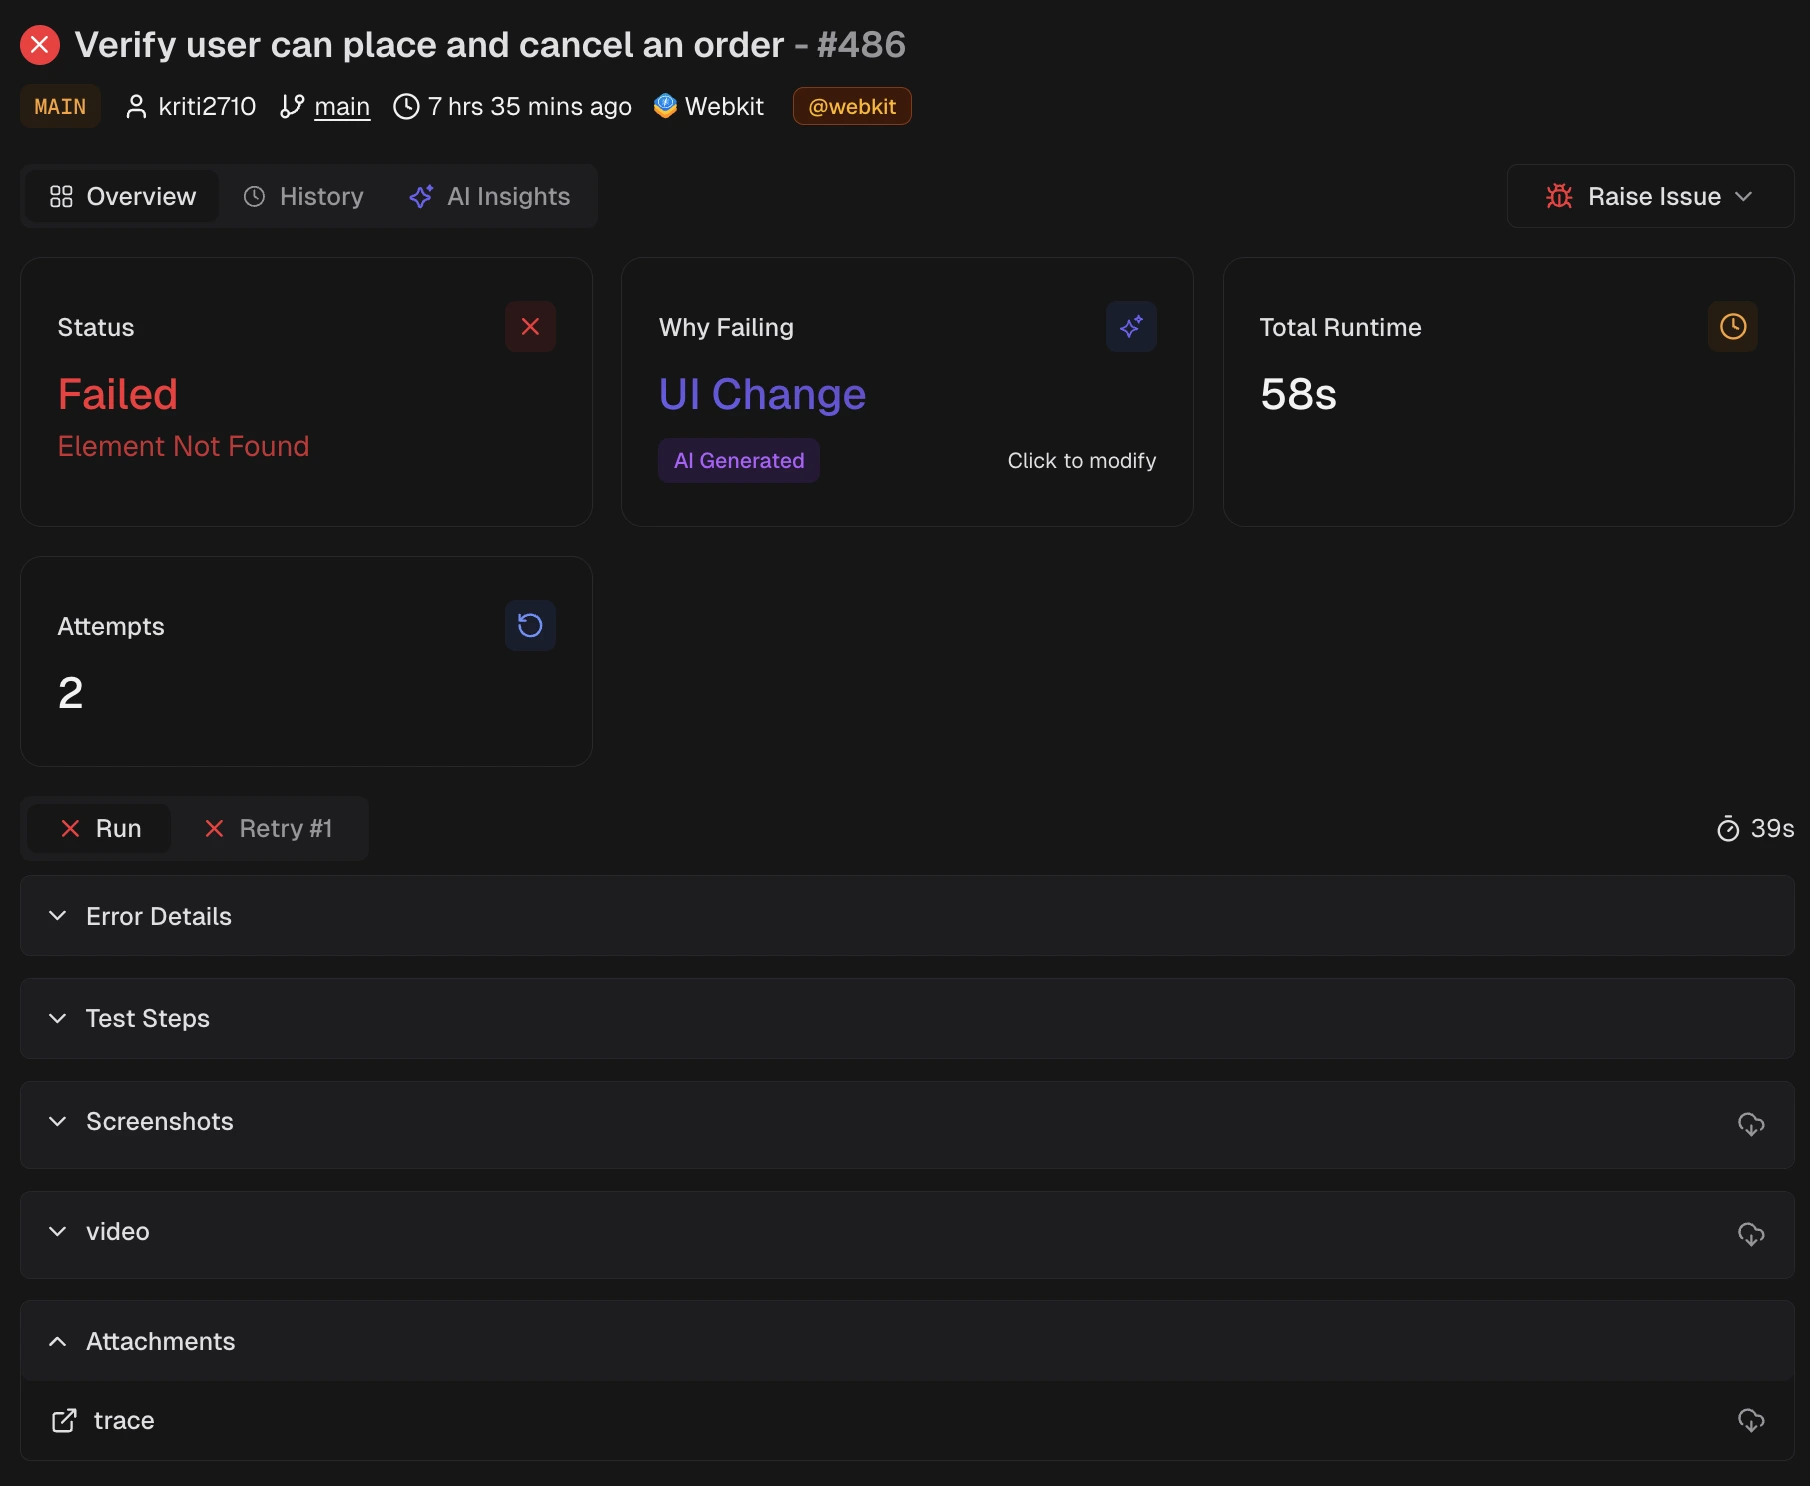
Open a test run and click on any failed test. The test case details page shows:
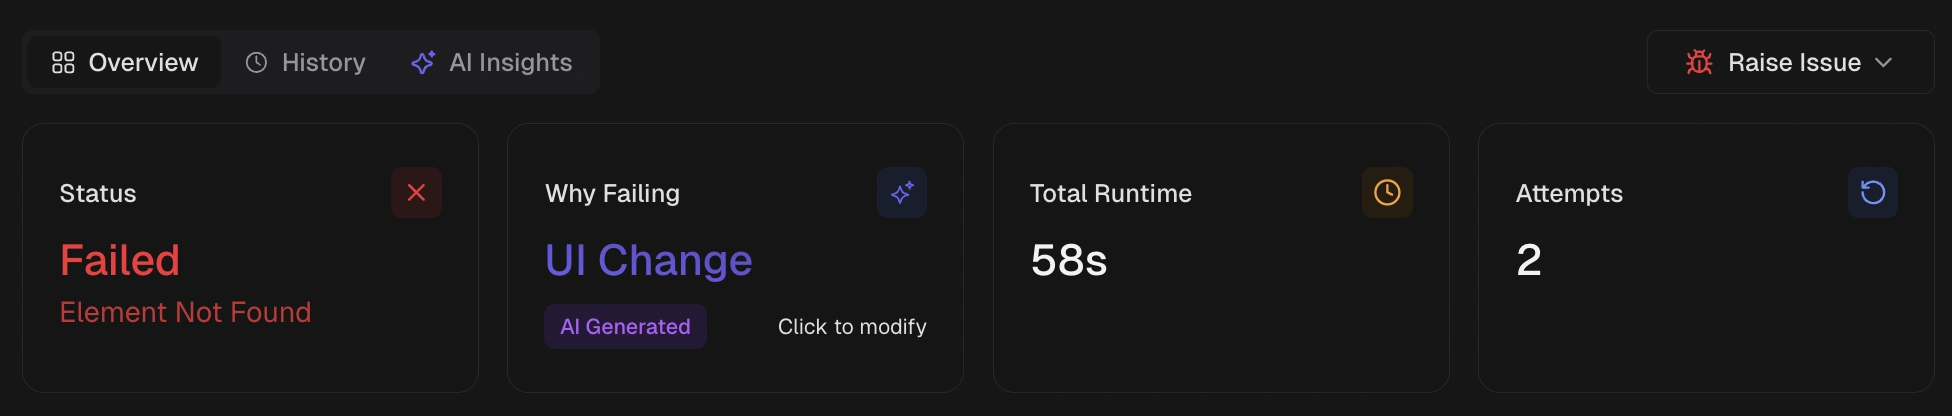
1. **KPI tiles:** Status, runtime, retry attempts
2. **Evidence tabs:** One tab per attempt (Run, Retry 1, Retry 2)
 Each evidence tab contains:
* Error details with stack trace
* Test steps with timing
* Screenshots
* Console output
* Video player
* Trace viewer link
* Visual comparison (for screenshot tests)
Each evidence tab contains:
* Error details with stack trace
* Test steps with timing
* Screenshots
* Console output
* Video player
* Trace viewer link
* Visual comparison (for screenshot tests)
 ## Debugging Workflow
Start with the error details. The message often points to the issue: assertion mismatch, element not found, or timeout.
Look at the error category (assertion failure, timeout, element not found, etc.) to determine whether to fix code, update selectors, or stabilize the test.
Screenshots show the UI state at failure. Compare with expected behavior.
Videos reveal timing issues and unexpected interactions that screenshots miss.
[Traces](/guides/playwright-trace-viewer) provide the most detail: every action, network request, and DOM change. Use traces for complex failures.
Console output shows JavaScript errors, failed API calls, and application logs.
## AI Categories
| Category | What it means | Action |
| :------------ | :---------------------------------------- | :----------------------------- |
| Actual Bug | Repeatable product defect | Fix application code |
| UI Change | Interface changed, test no longer matches | Update selectors or assertions |
| Unstable Test | Intermittent failure from timing or state | Stabilize the test |
| Miscellaneous | Environment or configuration problem | Fix infrastructure or CI |
## Debugging Workflow
Start with the error details. The message often points to the issue: assertion mismatch, element not found, or timeout.
Look at the error category (assertion failure, timeout, element not found, etc.) to determine whether to fix code, update selectors, or stabilize the test.
Screenshots show the UI state at failure. Compare with expected behavior.
Videos reveal timing issues and unexpected interactions that screenshots miss.
[Traces](/guides/playwright-trace-viewer) provide the most detail: every action, network request, and DOM change. Use traces for complex failures.
Console output shows JavaScript errors, failed API calls, and application logs.
## AI Categories
| Category | What it means | Action |
| :------------ | :---------------------------------------- | :----------------------------- |
| Actual Bug | Repeatable product defect | Fix application code |
| UI Change | Interface changed, test no longer matches | Update selectors or assertions |
| Unstable Test | Intermittent failure from timing or state | Stabilize the test |
| Miscellaneous | Environment or configuration problem | Fix infrastructure or CI |
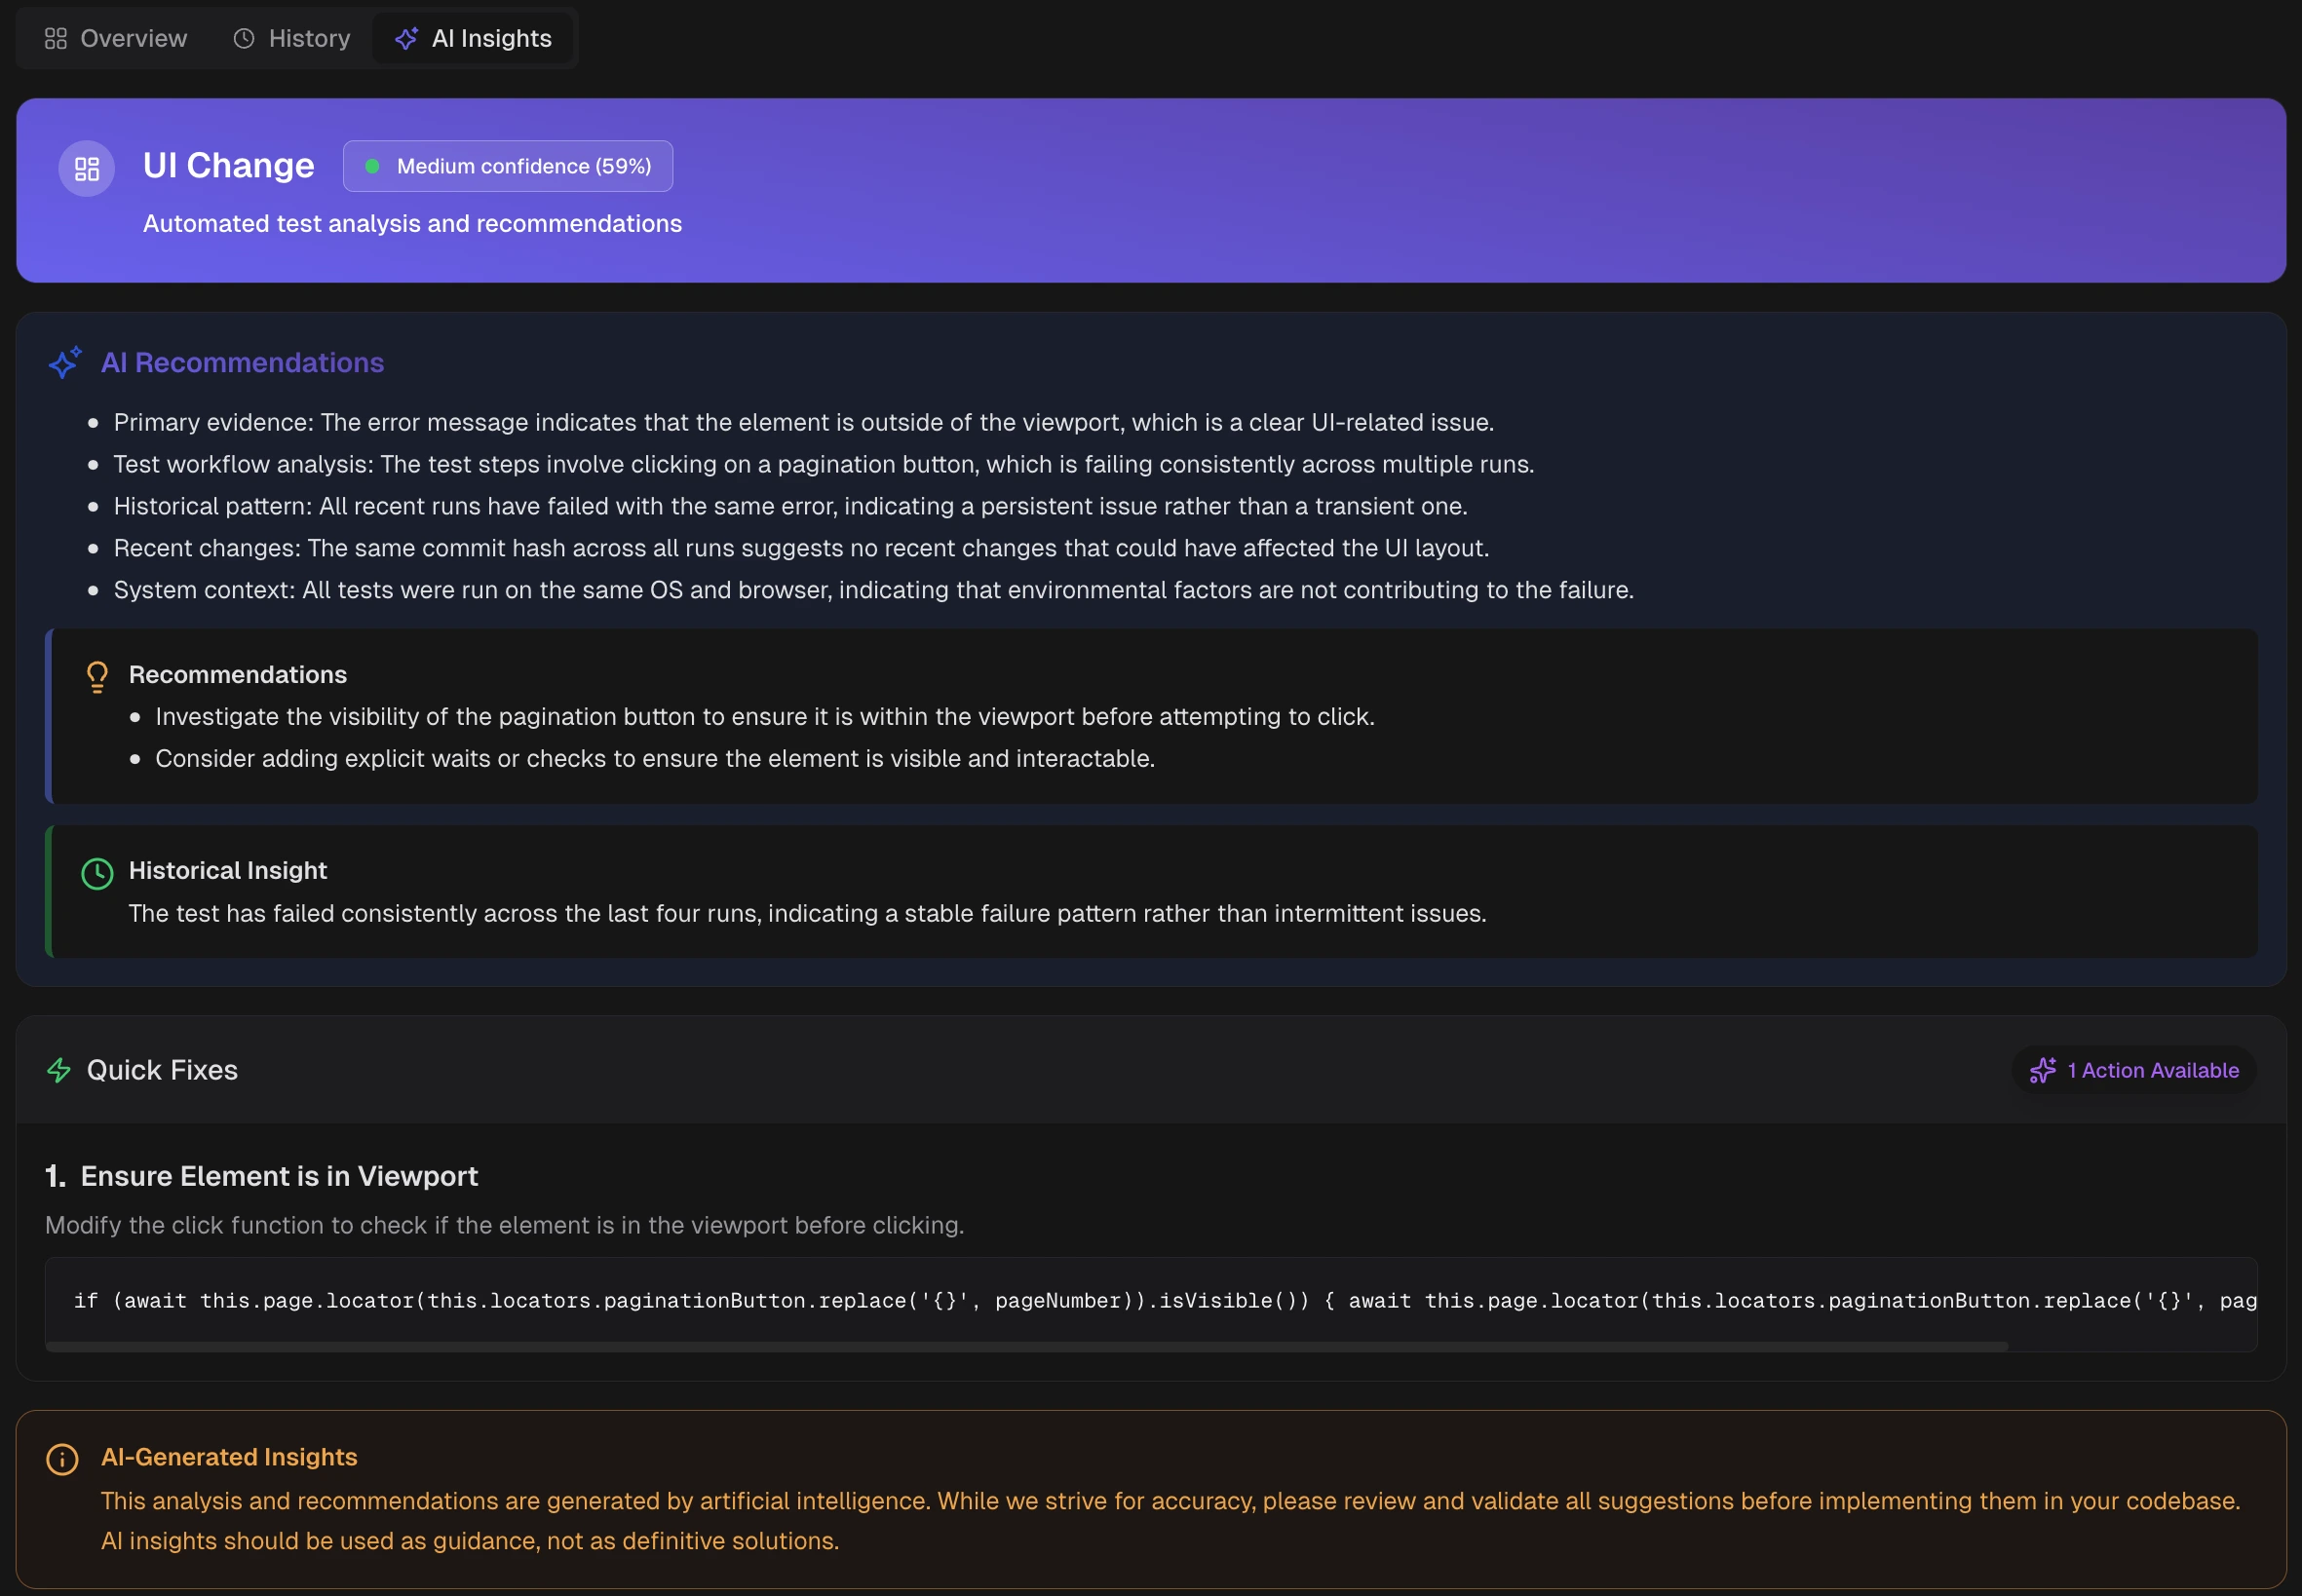 **Tip**
Each classification includes a confidence score. Use the feedback form to correct misclassifications.
## Next Steps
Step-by-step execution analysis
Screenshots and videos
Find patterns across failures
Full test case documentation
**Tip**
Each classification includes a confidence score. Use the feedback form to correct misclassifications.
## Next Steps
Step-by-step execution analysis
Screenshots and videos
Find patterns across failures
Full test case documentation