> ## Documentation Index
> Fetch the complete documentation index at: https://docs.testdino.com/llms.txt
> Use this file to discover all available pages before exploring further.
# Playwright Error Grouping in TestDino
> Group failures by root cause with AI-powered classification.
**What you'll learn**
* How errors are grouped at run and cross-run levels
* How AI categorizes failures by root cause
* How to triage grouped errors to fix multiple tests at once
TestDino groups errors by message and uses AI to categorize failures by root cause. Instead of investigating each failure individually, identify the common cause and fix it.
## Quick Reference
TestDino groups errors at two levels. Use this table to understand how grouping works and locate each view.
| Grouping Level | What It Shows |
| :--------------------------------------- | :----------------------------------------- |
| [Error message](#view-error-groups) | Tests that failed with the same error text |
| [Error category](#view-error-categories) | Tests grouped by error type |
## How Error Grouping Works
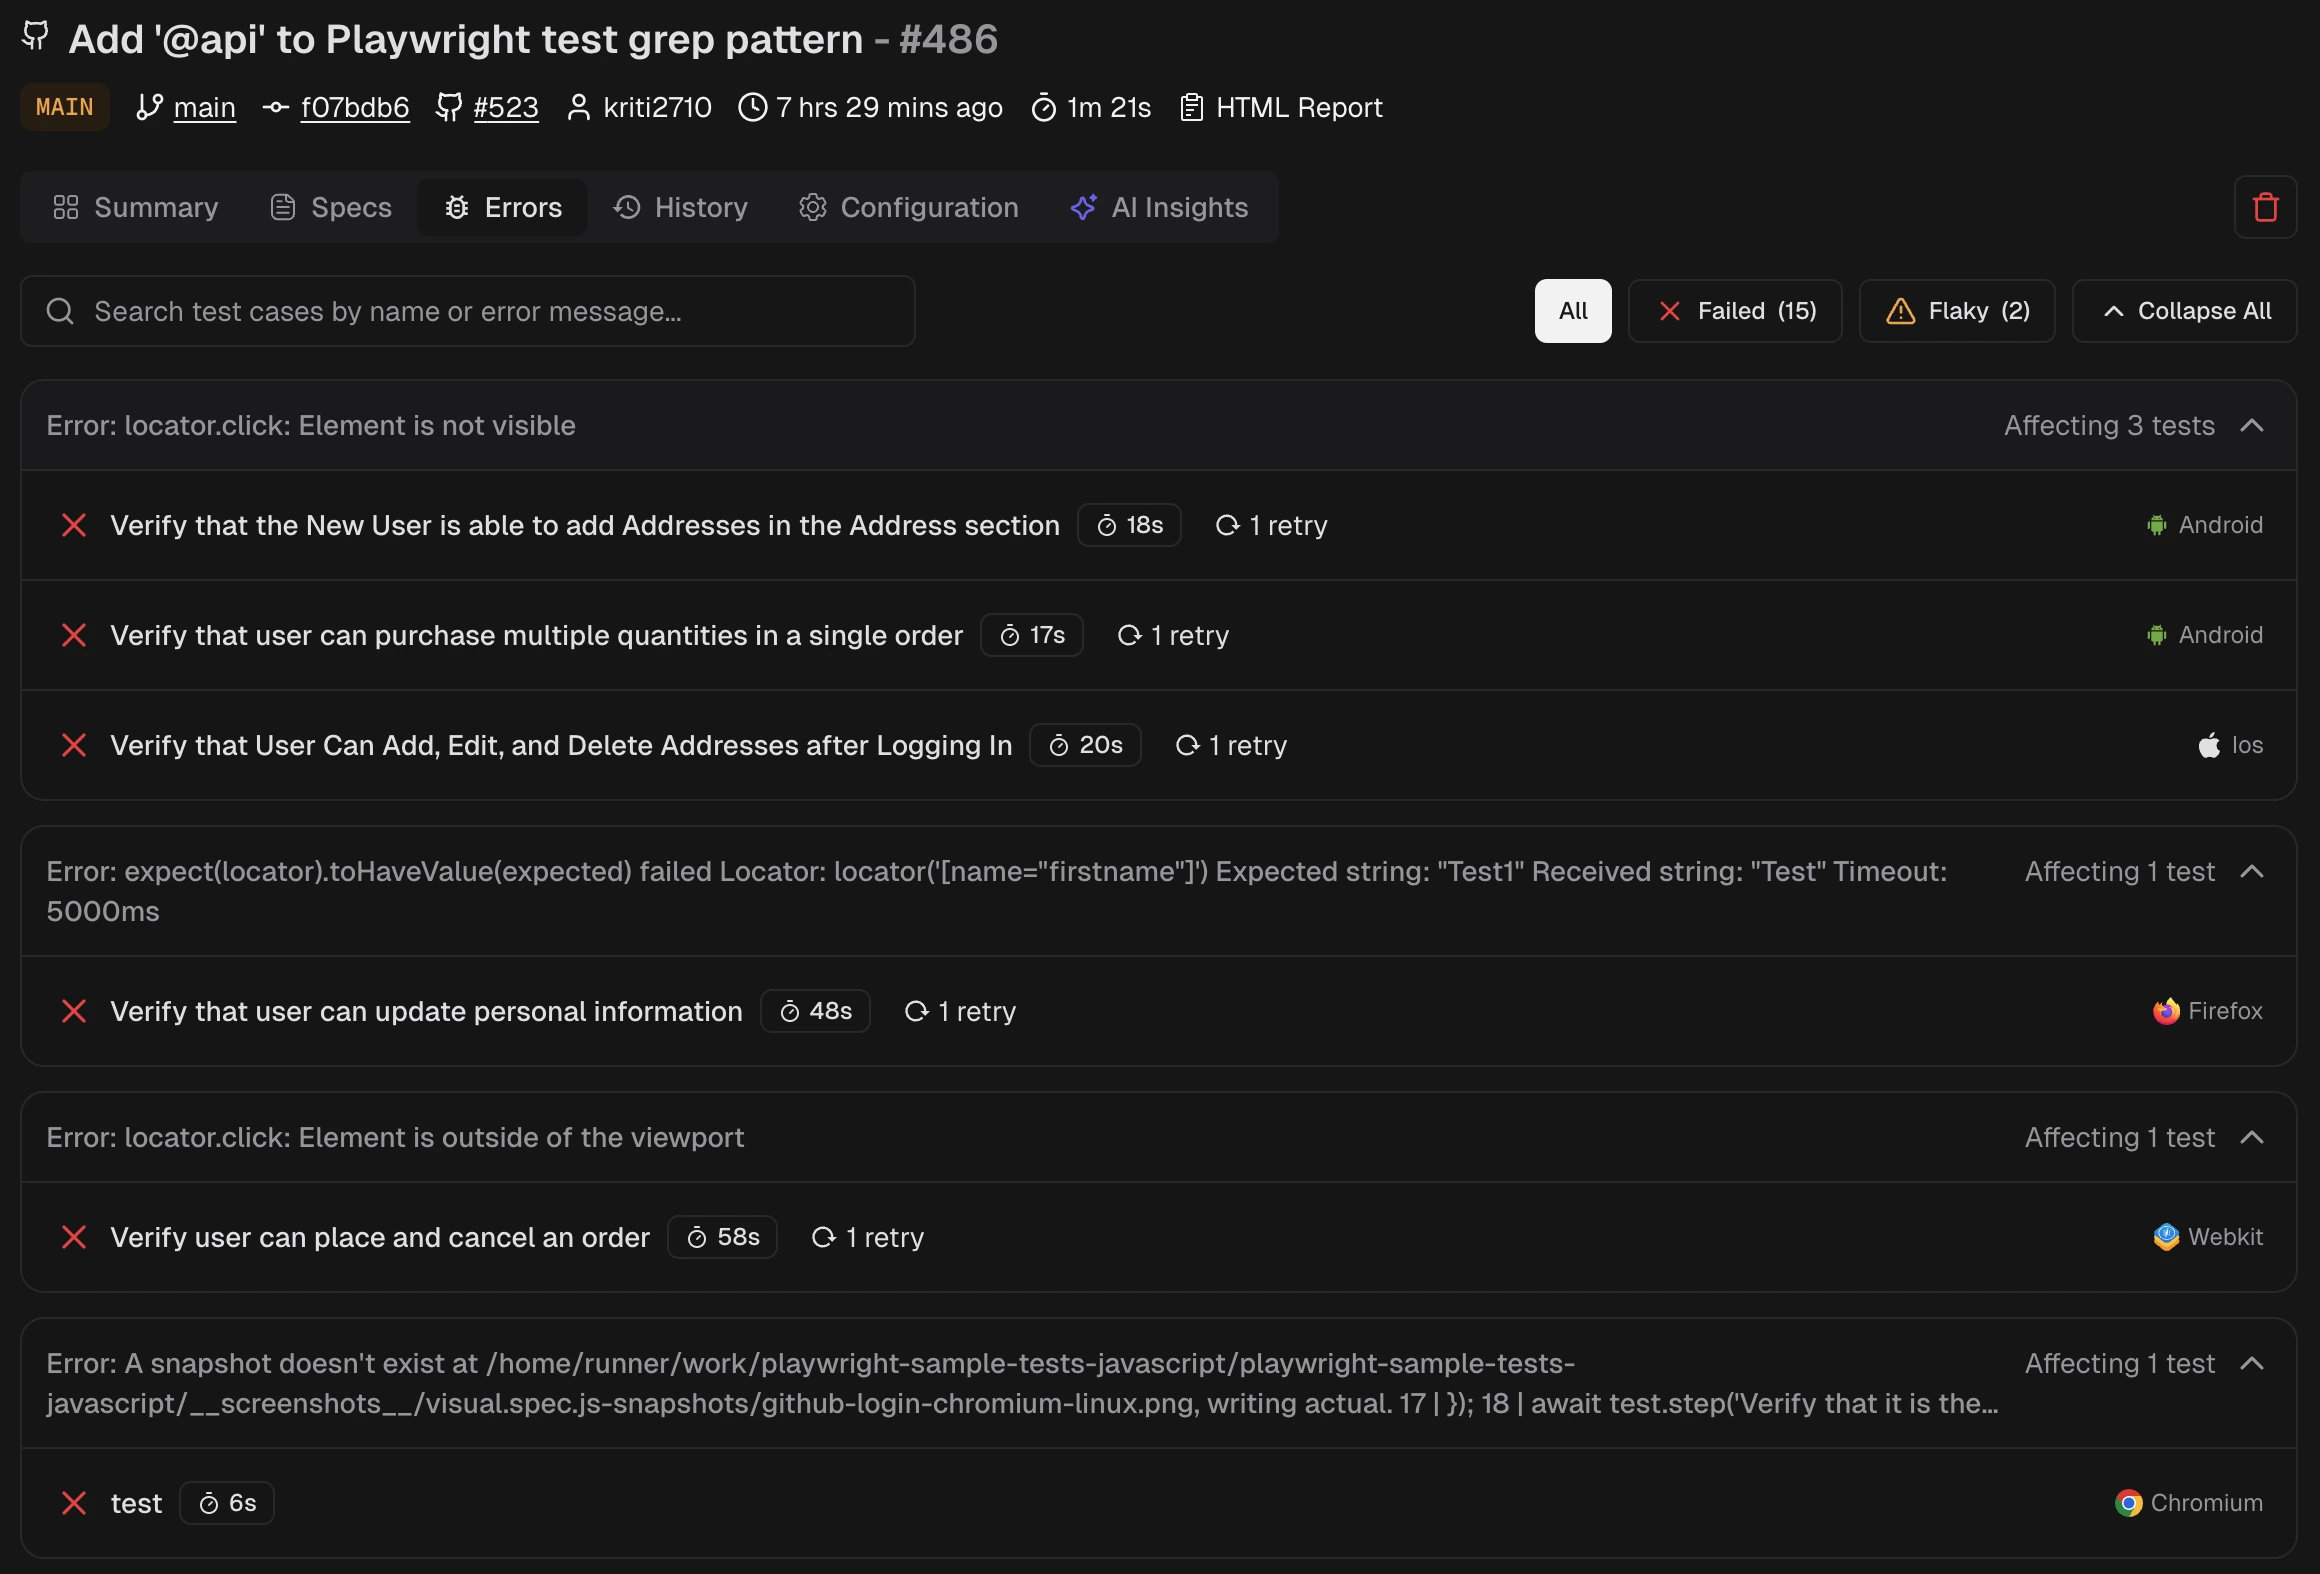
When multiple tests fail with similar errors, TestDino groups failures by error message.
TestDino matches errors by:
* Error message text
* Stack trace patterns
* Failure location in code
Similar errors appear as a single group with a count of affected tests.
## View Error Groups
1. Open a test run
2. Go to the **Errors** tab
3. Expand an error group to see all affected tests
 ## View Error Categories
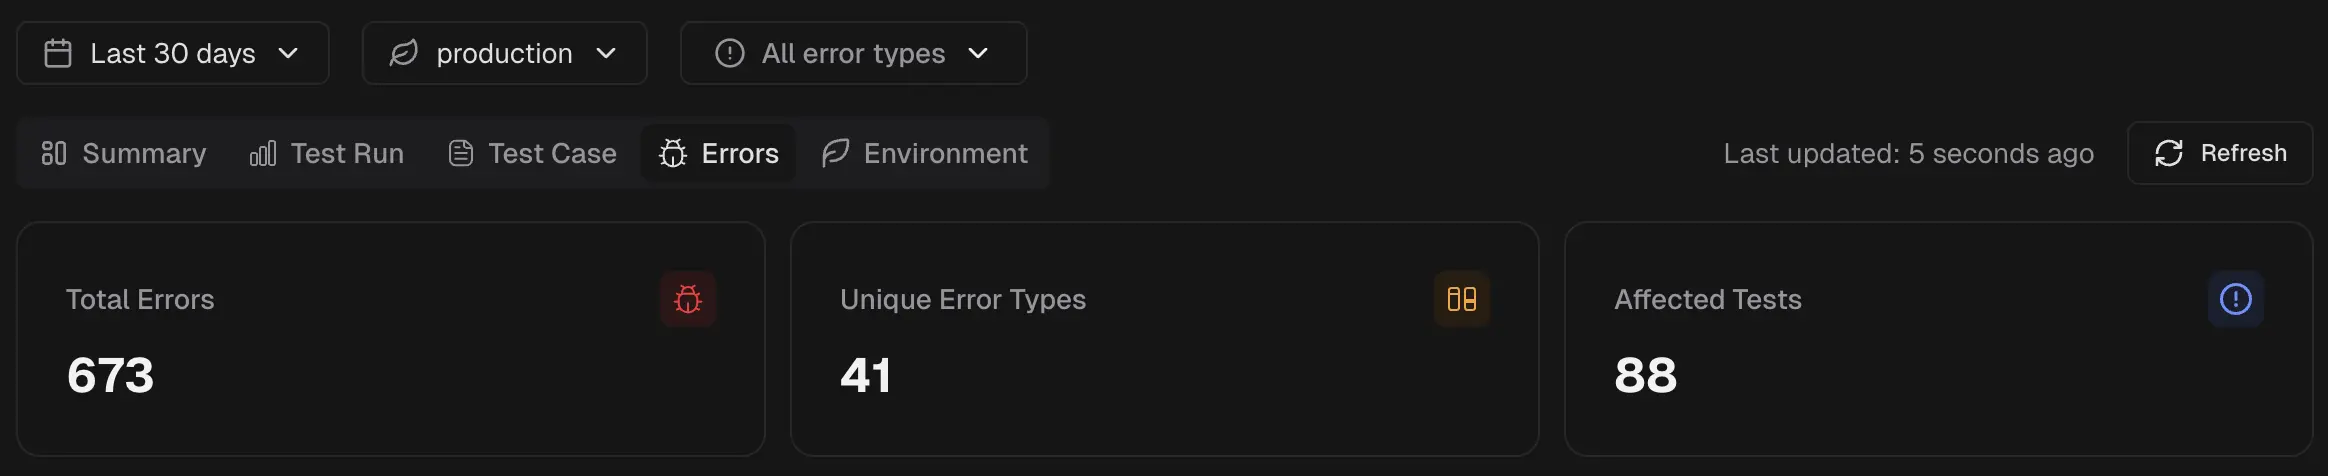
Navigate to the Analytics section
Click on the Errors tab to view error patterns
View error patterns across multiple runs
## View Error Categories
Navigate to the Analytics section
Click on the Errors tab to view error patterns
View error patterns across multiple runs
 **Note**
Analytics shows error trends over time. A new error group appearing after a deployment indicates a regression.
TestDino classifies errors into categories:
| Category | Description |
| :----------------- | :--------------------------------------------- |
| Assertion Failures | Expected values did not match actual values |
| Timeout Issues | Actions or waits exceeded time limits |
| Element Not Found | Locators did not resolve to elements |
| Network Issues | HTTP requests failed or returned errors |
| JavaScript Errors | Runtime errors in browser or test code |
| Browser Issues | Browser launch, context, or rendering problems |
| Other Failures | Errors outside the above categories |
Filter by category to focus on specific error types.
## Error Analytics
Open **Analytics → Errors** for trends over time:
[**Error Message Over Time**](/platform/analytics/errors#error-message-over-time)**:** Line graph showing error frequency by category. Identify spikes and trends.
**Note**
Analytics shows error trends over time. A new error group appearing after a deployment indicates a regression.
TestDino classifies errors into categories:
| Category | Description |
| :----------------- | :--------------------------------------------- |
| Assertion Failures | Expected values did not match actual values |
| Timeout Issues | Actions or waits exceeded time limits |
| Element Not Found | Locators did not resolve to elements |
| Network Issues | HTTP requests failed or returned errors |
| JavaScript Errors | Runtime errors in browser or test code |
| Browser Issues | Browser launch, context, or rendering problems |
| Other Failures | Errors outside the above categories |
Filter by category to focus on specific error types.
## Error Analytics
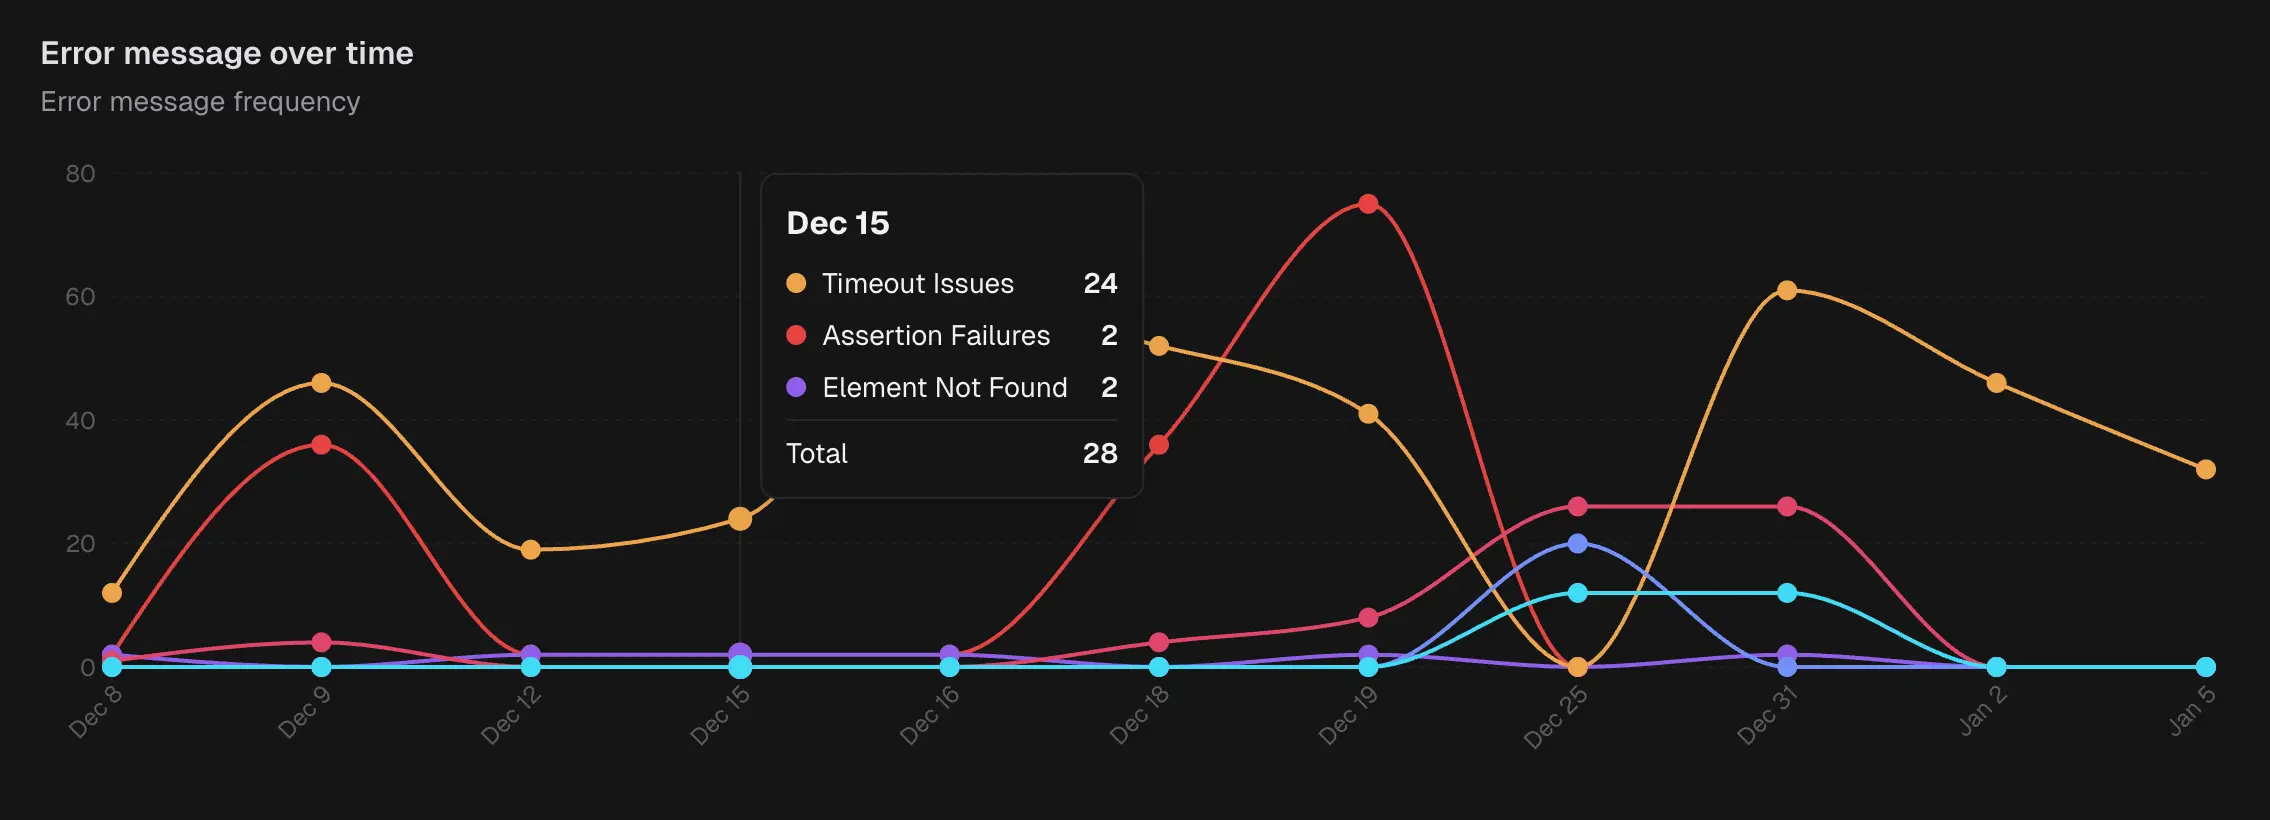
Open **Analytics → Errors** for trends over time:
[**Error Message Over Time**](/platform/analytics/errors#error-message-over-time)**:** Line graph showing error frequency by category. Identify spikes and trends.
 [**Error Categories Table**](/platform/analytics/errors#error-categories)**:** Breakdown of errors by type with occurrence counts, affected tests, and first/last detected dates.
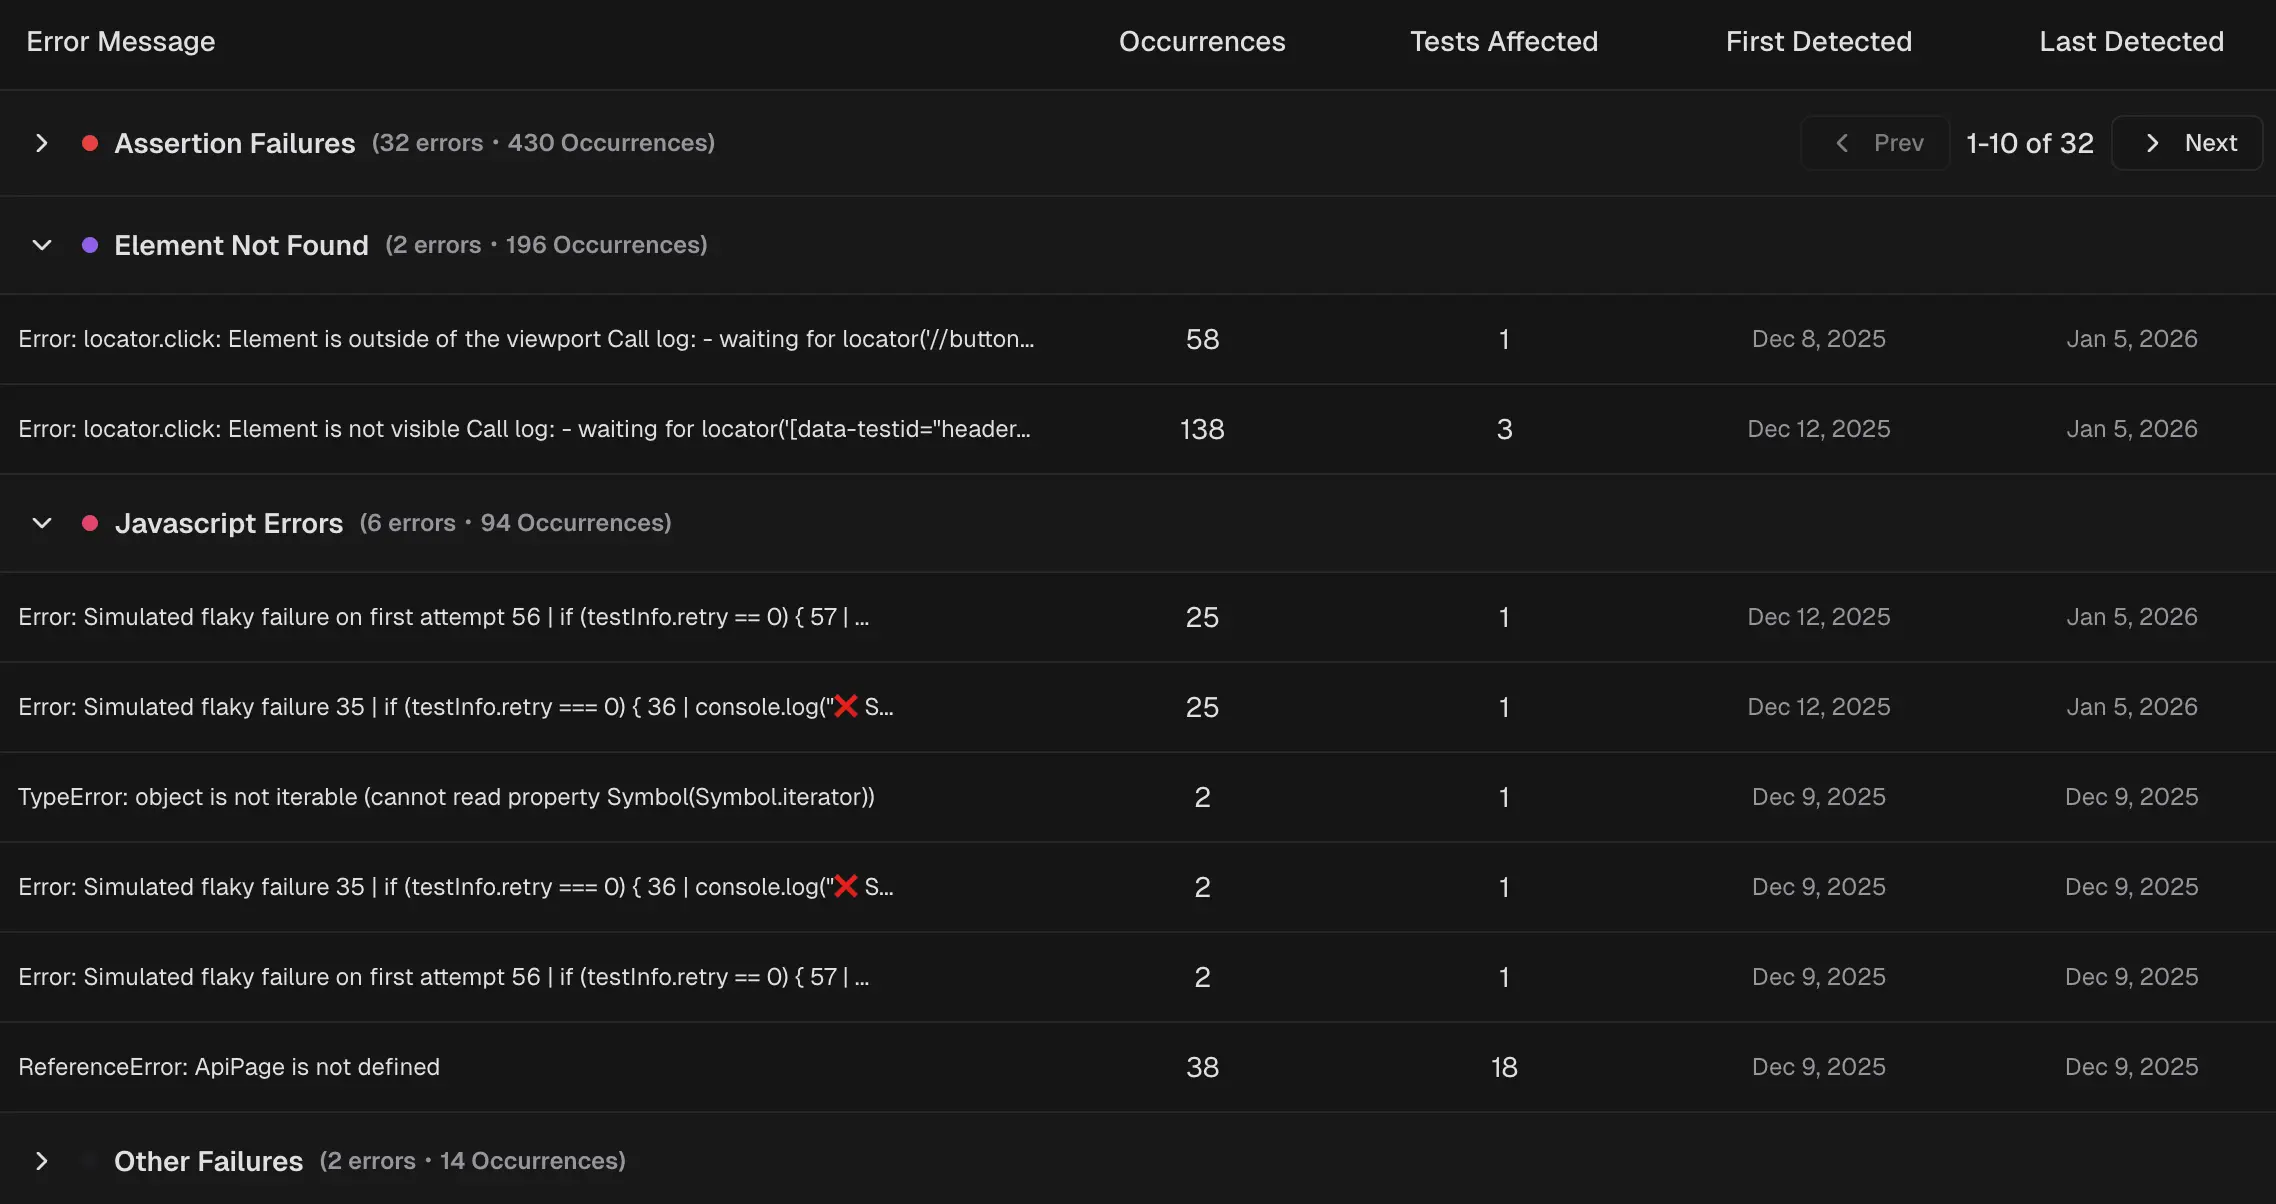 Click any error to see all affected test cases.
## Common Error Patterns
`Error: locator.click: Error: strict mode violation`
Multiple tests targeting the same element fail when the selector breaks. Fix the selector once.
`Error: Timeout 30000ms exceeded`
Often indicates a shared dependency: slow API, missing service, or environment issue. Check what the affected tests have in common.
`Error: expect(received).toBe(expected)`
Same assertion failing across tests may indicate a data issue or application bug affecting multiple pages.
`Error: net::ERR_CONNECTION_REFUSED`
Service unavailable. All tests depending on that service fail together.
## Create Tickets from Error Groups
When an error group needs attention:
Navigate to the error group you want to address
Click **Raise Bug** or **Raise Issue**
Select Jira, Linear, Asana, or monday
TestDino pre-fills the ticket with error details and the affected test count
**Tip**
The ticket links back to the error group for context.
## Related
Trace viewer, visual evidence, and debug overview.
Step-by-step execution analysis
Visual evidence
Error trends over time
Click any error to see all affected test cases.
## Common Error Patterns
`Error: locator.click: Error: strict mode violation`
Multiple tests targeting the same element fail when the selector breaks. Fix the selector once.
`Error: Timeout 30000ms exceeded`
Often indicates a shared dependency: slow API, missing service, or environment issue. Check what the affected tests have in common.
`Error: expect(received).toBe(expected)`
Same assertion failing across tests may indicate a data issue or application bug affecting multiple pages.
`Error: net::ERR_CONNECTION_REFUSED`
Service unavailable. All tests depending on that service fail together.
## Create Tickets from Error Groups
When an error group needs attention:
Navigate to the error group you want to address
Click **Raise Bug** or **Raise Issue**
Select Jira, Linear, Asana, or monday
TestDino pre-fills the ticket with error details and the affected test count
**Tip**
The ticket links back to the error group for context.
## Related
Trace viewer, visual evidence, and debug overview.
Step-by-step execution analysis
Visual evidence
Error trends over time