> ## Documentation Index
> Fetch the complete documentation index at: https://docs.testdino.com/llms.txt
> Use this file to discover all available pages before exploring further.
# Playwright Trace Viewer Online
> Step through traces with DOM, network, and console inspection.
export const VideoSchema = ({name, description, thumbnailUrl, uploadDate, duration, contentUrl, embedUrl}) => {
const schema = {
"@context": "https://schema.org",
"@type": "VideoObject",
name,
description,
thumbnailUrl,
uploadDate,
...duration ? {
duration
} : {},
...contentUrl ? {
contentUrl
} : {},
...embedUrl ? {
embedUrl
} : {},
publisher: {
"@type": "Organization",
name: "TestDino",
logo: {
"@type": "ImageObject",
url: "https://docs.testdino.com/logo/light.svg"
}
}
};
return ;
};
**What you'll learn**
* How to enable Playwright tracing in your config
* What each trace panel shows (actions, network, DOM, console)
* How to step through execution in the embedded viewer
Playwright traces capture every action, network request, and DOM state during test execution. TestDino displays these traces so you can debug failures without re-running tests locally.
## Quick Reference
The Trace Viewer has several panels, each displaying different execution details. Use this table to find the appropriate panel for your investigation.
| Trace Panel | What It Shows |
| :---------------------------- | :----------------------------------------- |
| [Actions](#actions-panel) | Each test step with timing and result |
| [Call](#navigate-the-trace) | Arguments and return values for the action |
| [Console](#console-tab) | Browser console output at each step |
| [Network](#network-tab) | HTTP requests and responses |
| [Source](#source-tab) | Test code with current line highlighted |
| [DOM Snapshot](#dom-snapshot) | Page structure at each action |
See [Playwright trace documentation](https://playwright.dev/docs/docs/trace-viewer) for more options.
## Enable Traces
Configure Playwright to record traces:
```typescript theme={null}
// playwright.config.ts
export default defineConfig({
use: {
trace: 'on-first-retry', // Capture on retries only
}
});
```
Options:
| Value | Behavior |
| :-------------------- | :-------------------------------- |
| `'off'` | No traces |
| `'on'` | Trace every test |
| `'on-first-retry'` | Trace only on retry (recommended) |
| `'retain-on-failure'` | Keep traces for failed tests |
Traces add overhead. Use `'on-first-retry'` to balance debugging capability with test speed.
## Upload Traces
Include trace files in your upload with `--upload-traces`:
```bash theme={null}
npx tdpw upload ./playwright-report --token="$TESTDINO_TOKEN" --upload-traces
```
`--upload-full-json` uploads traces along with all other attachments, and `--upload-html` bundles traces with HTML reports. Use `--upload-traces` for traces only. Without one of these flags, trace links in TestDino will not resolve.
## When to Use Traces
Traces are most useful for:
* **Race conditions:** See if an element appeared after the test tried to interact
* **Timing issues:** Check how long each step took
* **Network failures:** Inspect API requests and responses
* **Complex flows:** Step through multi-page interactions
For simple failures, start with screenshots or error messages. Open traces when you need more detail.
## Open the Trace Viewer
Navigate to the test run in TestDino
Select the test you want to debug
Choose Run, Retry 1, or Retry 2
Click **View Trace** or the trace viewer link
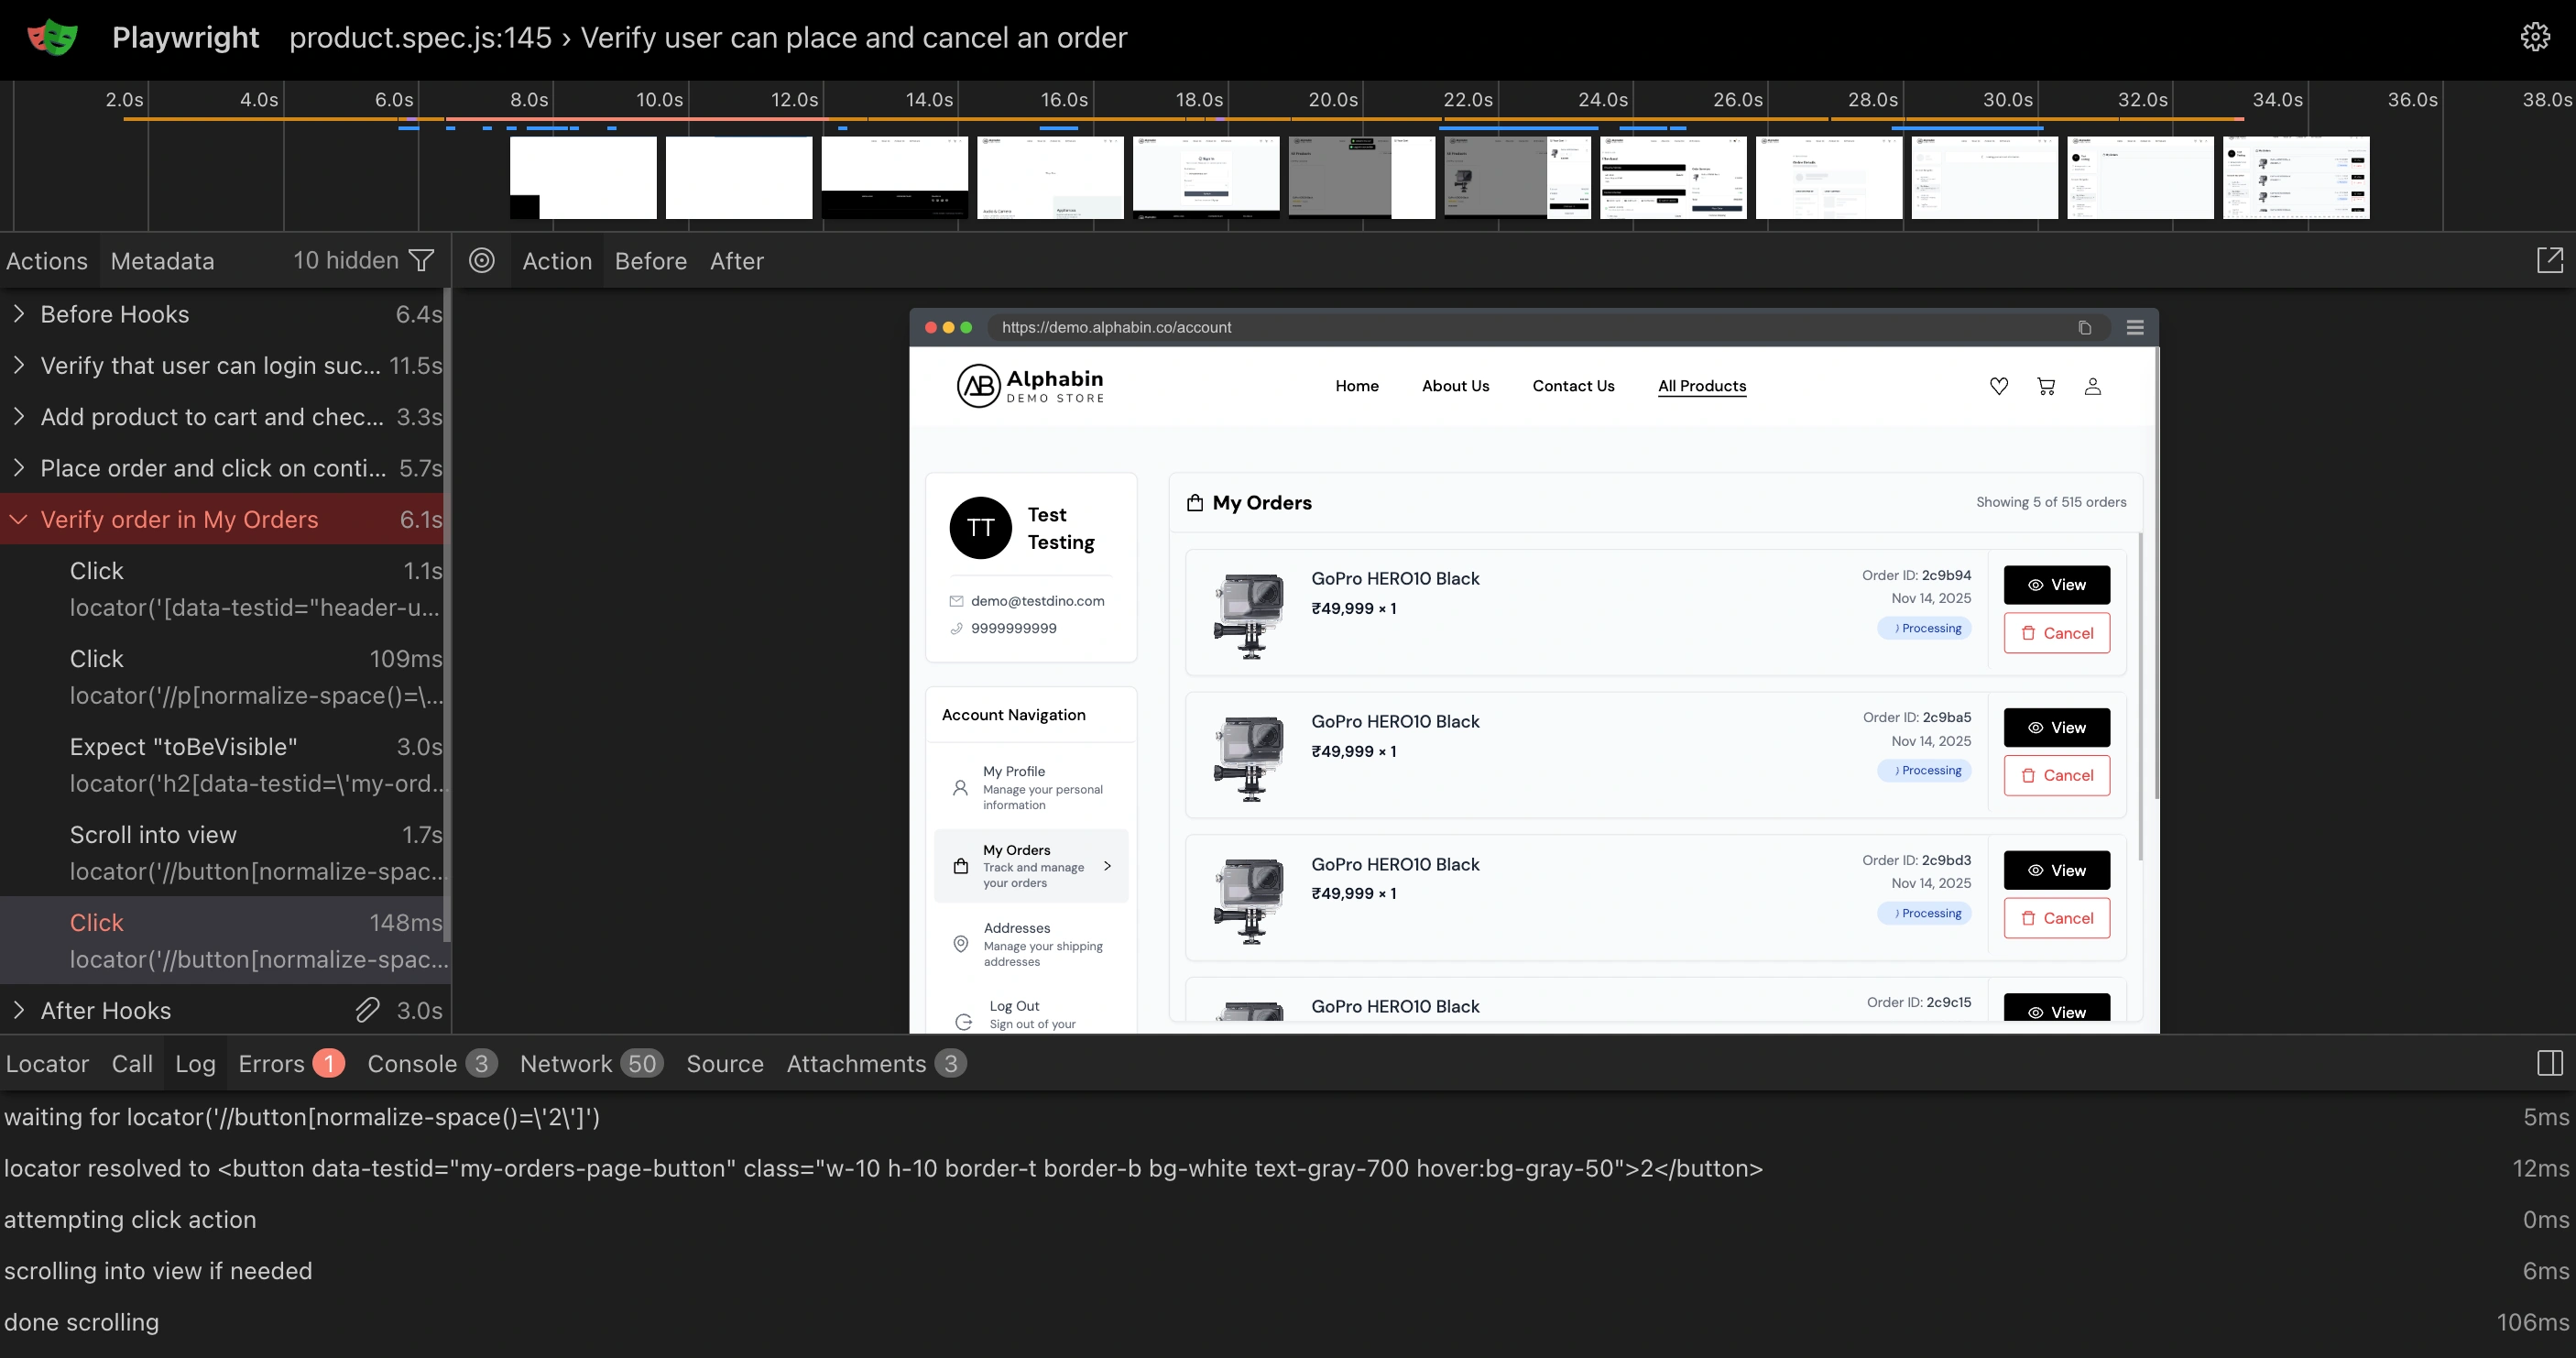 **Tip**
The trace opens in a new tab with the full Playwright trace UI.
## Use a Custom Trace Viewer
Point a project at your own trace viewer to open traces somewhere other than the default `https://trace.playwright.dev`. Every trace link in the project then opens in your viewer. This is available on Enterprise plans.
Set the URL under **Project Settings → General → Trace Viewer**.
| Detail | Value |
| :-------------- | :------------------------------------------------------- |
| Default | `https://trace.playwright.dev` |
| Requirement | URL must use `https` and support the `?trace=` parameter |
| Scope | Every trace link in the project |
| Clear the field | Reverts to the default viewer |
| Permissions | Admin roles only |
A custom viewer must accept the same `?trace=` parameter as the default viewer, such as a self-hosted Playwright fork that adds extra panels.
**Note**
The custom viewer changes where the trace opens. Trace recording and upload are unchanged.
## Navigate the Trace
### Actions Panel
The left sidebar lists every action in execution order:
* `page.goto`
* `locator.click`
* `expect.toBeVisible`
Click any action to see its details. Failed actions are highlighted in red.
### Timeline
The timeline at the top shows action duration. Long bars indicate slow steps. Gaps may indicate waiting or idle time.
### DOM Snapshot
Each action captures a DOM snapshot. Use it to see:
* Whether the element existed
* What the page looked like at that moment
* If other elements were blocking the target
Toggle between **Before** and **After** to see DOM changes from the action.
### Network Tab
View all HTTP requests during the test:
* Request URL, method, and headers
* Response status, headers, and body
* Timing breakdown (DNS, connect, SSL, wait, download)
Failed requests appear in red. Look for 4xx/5xx responses or timeouts.
### Console Tab
Shows browser console output at each action:
* `console.log` from application code
* JavaScript errors and warnings
* Failed resource loads
Console errors often reveal issues not visible in the UI.
### Source Tab
Displays the test code with the current action highlighted. Useful for correlating trace steps with your test file.
## Debug Common Failures
| Pattern | What to check |
| :--------------------------------------- | :------------------------------------------------- |
| [Element not found](#element-not-found) | DOM snapshot at failing step |
| [Timeout](#timeout) | Timeline for long gaps, network for slow responses |
| [Assertion mismatch](#assertion-failure) | Expected vs actual in DOM snapshot |
| [Race condition](#race-condition) | Action order across runs |
1. Go to the failed action
2. Check the DOM snapshot
3. Look for the target element
If the element exists but the locator did not match, the selector is wrong. If the element does not exist, the page state was different than expected.
1. Check the action duration in the timeline
2. Look at the DOM snapshot before timeout
3. Check the network tab for pending requests
Timeouts often mean the page was still loading or an element was not yet visible.
1. Go to the failed `expect` action
2. Check the Call panel for expected vs actual values
3. Review the DOM snapshot to see the actual state
1. Compare DOM snapshots before and after the action
2. Check if elements appeared or disappeared between steps
3. Look at network timing to see if responses arrived late
## Related
Error grouping, visual evidence, and debug overview.
Screenshots and videos
Find patterns across failures
Identify and manage flaky tests
Upload options reference
**Tip**
The trace opens in a new tab with the full Playwright trace UI.
## Use a Custom Trace Viewer
Point a project at your own trace viewer to open traces somewhere other than the default `https://trace.playwright.dev`. Every trace link in the project then opens in your viewer. This is available on Enterprise plans.
Set the URL under **Project Settings → General → Trace Viewer**.
| Detail | Value |
| :-------------- | :------------------------------------------------------- |
| Default | `https://trace.playwright.dev` |
| Requirement | URL must use `https` and support the `?trace=` parameter |
| Scope | Every trace link in the project |
| Clear the field | Reverts to the default viewer |
| Permissions | Admin roles only |
A custom viewer must accept the same `?trace=` parameter as the default viewer, such as a self-hosted Playwright fork that adds extra panels.
**Note**
The custom viewer changes where the trace opens. Trace recording and upload are unchanged.
## Navigate the Trace
### Actions Panel
The left sidebar lists every action in execution order:
* `page.goto`
* `locator.click`
* `expect.toBeVisible`
Click any action to see its details. Failed actions are highlighted in red.
### Timeline
The timeline at the top shows action duration. Long bars indicate slow steps. Gaps may indicate waiting or idle time.
### DOM Snapshot
Each action captures a DOM snapshot. Use it to see:
* Whether the element existed
* What the page looked like at that moment
* If other elements were blocking the target
Toggle between **Before** and **After** to see DOM changes from the action.
### Network Tab
View all HTTP requests during the test:
* Request URL, method, and headers
* Response status, headers, and body
* Timing breakdown (DNS, connect, SSL, wait, download)
Failed requests appear in red. Look for 4xx/5xx responses or timeouts.
### Console Tab
Shows browser console output at each action:
* `console.log` from application code
* JavaScript errors and warnings
* Failed resource loads
Console errors often reveal issues not visible in the UI.
### Source Tab
Displays the test code with the current action highlighted. Useful for correlating trace steps with your test file.
## Debug Common Failures
| Pattern | What to check |
| :--------------------------------------- | :------------------------------------------------- |
| [Element not found](#element-not-found) | DOM snapshot at failing step |
| [Timeout](#timeout) | Timeline for long gaps, network for slow responses |
| [Assertion mismatch](#assertion-failure) | Expected vs actual in DOM snapshot |
| [Race condition](#race-condition) | Action order across runs |
1. Go to the failed action
2. Check the DOM snapshot
3. Look for the target element
If the element exists but the locator did not match, the selector is wrong. If the element does not exist, the page state was different than expected.
1. Check the action duration in the timeline
2. Look at the DOM snapshot before timeout
3. Check the network tab for pending requests
Timeouts often mean the page was still loading or an element was not yet visible.
1. Go to the failed `expect` action
2. Check the Call panel for expected vs actual values
3. Review the DOM snapshot to see the actual state
1. Compare DOM snapshots before and after the action
2. Check if elements appeared or disappeared between steps
3. Look at network timing to see if responses arrived late
## Related
Error grouping, visual evidence, and debug overview.
Screenshots and videos
Find patterns across failures
Identify and manage flaky tests
Upload options reference