> ## Documentation Index
> Fetch the complete documentation index at: https://docs.testdino.com/llms.txt
> Use this file to discover all available pages before exploring further.
# Playwright Code Coverage Analytics
> Track code coverage trends and compare coverage across branches.
**What you'll learn**
* How to track coverage trends (statements, branches, functions, lines) over time
* How to compare coverage between branches
* How coverage diff surfaces regressions
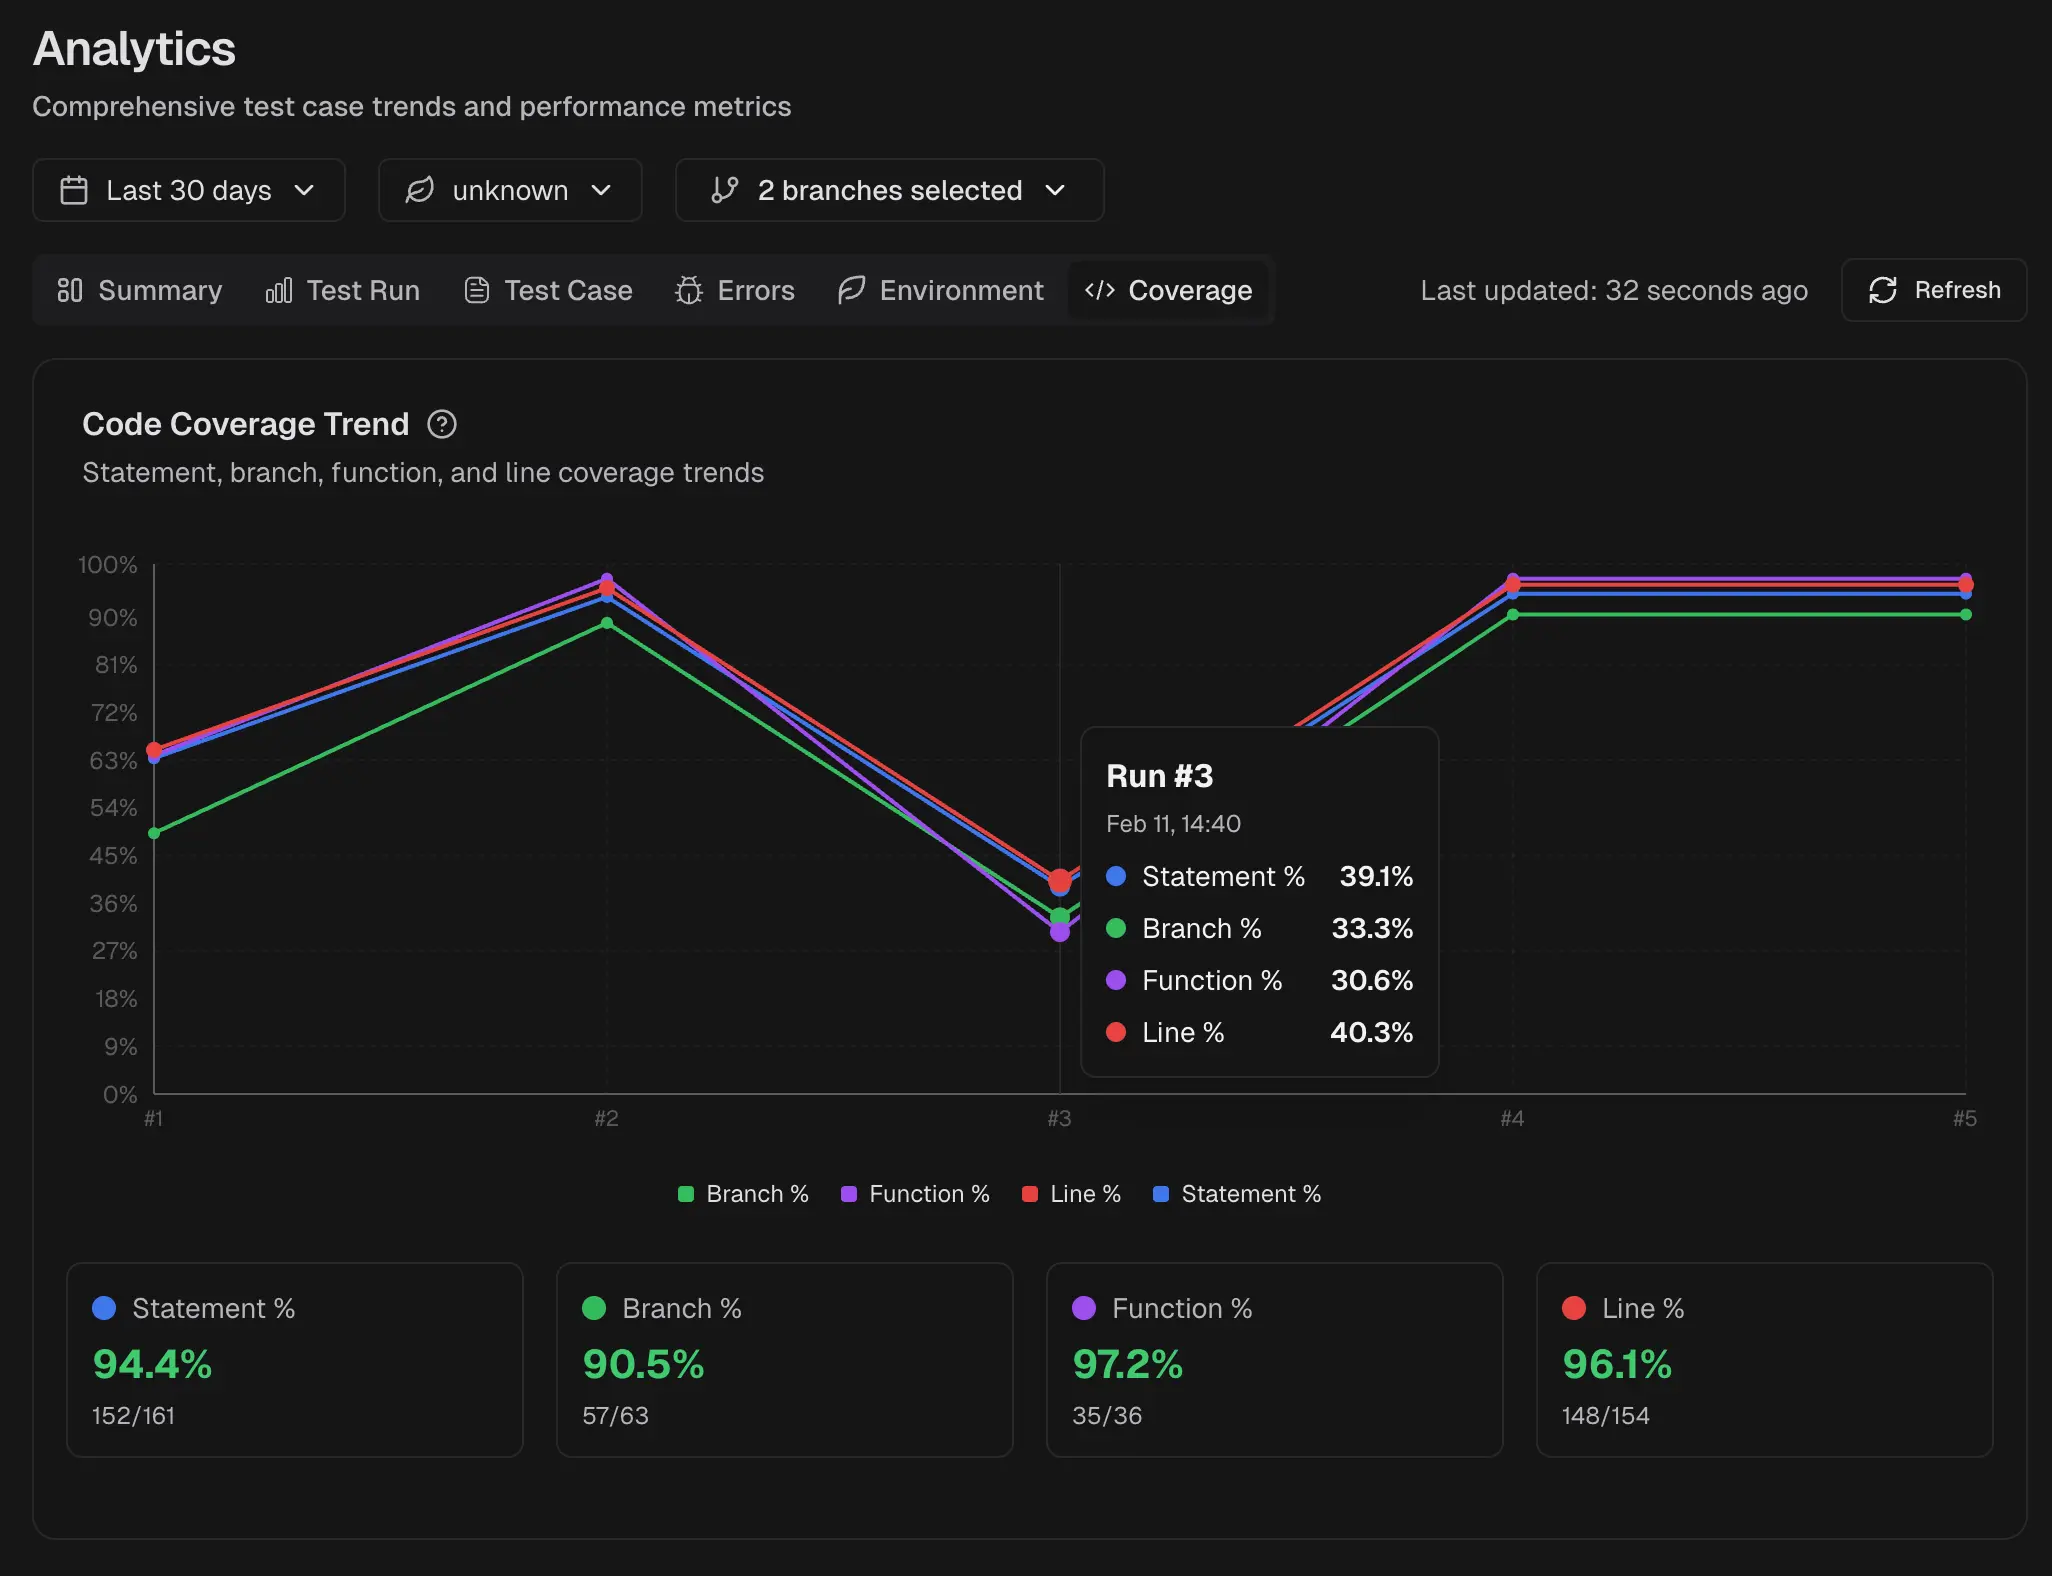
Coverage analytics shows how your code coverage changes over time. Use it to catch coverage drops, compare coverage across branches, and confirm that new tests improve overall coverage.
 **Note**
Coverage data requires the `@testdino/playwright` streaming reporter (Experimental) with `coverage.enabled: true`. See the [Code Coverage guide](/guides/playwright-code-coverage) for setup.
## Coverage Trends
A time-series chart plots coverage metrics (statements, branches, functions, lines) across the selected period. Each data point represents one test run. For sharded runs, the data point reflects the merged coverage across all shards.
Use this chart to:
* Spot sudden drops that match a specific commit or PR
* Confirm that adding new tests raised coverage
* Track progress toward a team coverage target
Toggle individual metrics on or off to focus on a specific coverage type. Hover over a data point to see the exact percentages and the associated commit.
## Coverage by Branch
Compare average statement coverage across branches. If a branch has lower coverage than `main`, tests are missing for the code changes on that branch.
## Coverage Diff
The diff view compares coverage between two branches or time periods. It surfaces files where coverage changed, sorted by the largest regressions first.
| Column | Description |
| :---------- | :-------------------------------------------- |
| **File** | Source file path |
| **Base** | Coverage percentage on the base branch |
| **Compare** | Coverage percentage on the compared branch |
| **Change** | Difference in coverage (positive or negative) |
Use this view to:
* Validate that a feature branch maintains or improves coverage before merging
* Identify files that lost coverage after a refactor
* Compare coverage across environments or time periods
## Filters
Narrow the data by time period, environment, or branch.
| Filter | What it does |
| :-------------- | :---------------------------------------------------------- |
| **Time Period** | Show coverage data within a date range |
| **Environment** | Scope to a specific environment (production, staging, etc.) |
| **Branch** | Focus on one or more branches |
## Related
Set up instrumentation and coverage collection
Per-run coverage breakdown
Overall test suite health trends
Compare test health across environments
**Note**
Coverage data requires the `@testdino/playwright` streaming reporter (Experimental) with `coverage.enabled: true`. See the [Code Coverage guide](/guides/playwright-code-coverage) for setup.
## Coverage Trends
A time-series chart plots coverage metrics (statements, branches, functions, lines) across the selected period. Each data point represents one test run. For sharded runs, the data point reflects the merged coverage across all shards.
Use this chart to:
* Spot sudden drops that match a specific commit or PR
* Confirm that adding new tests raised coverage
* Track progress toward a team coverage target
Toggle individual metrics on or off to focus on a specific coverage type. Hover over a data point to see the exact percentages and the associated commit.
## Coverage by Branch
Compare average statement coverage across branches. If a branch has lower coverage than `main`, tests are missing for the code changes on that branch.
## Coverage Diff
The diff view compares coverage between two branches or time periods. It surfaces files where coverage changed, sorted by the largest regressions first.
| Column | Description |
| :---------- | :-------------------------------------------- |
| **File** | Source file path |
| **Base** | Coverage percentage on the base branch |
| **Compare** | Coverage percentage on the compared branch |
| **Change** | Difference in coverage (positive or negative) |
Use this view to:
* Validate that a feature branch maintains or improves coverage before merging
* Identify files that lost coverage after a refactor
* Compare coverage across environments or time periods
## Filters
Narrow the data by time period, environment, or branch.
| Filter | What it does |
| :-------------- | :---------------------------------------------------------- |
| **Time Period** | Show coverage data within a date range |
| **Environment** | Scope to a specific environment (production, staging, etc.) |
| **Branch** | Focus on one or more branches |
## Related
Set up instrumentation and coverage collection
Per-run coverage breakdown
Overall test suite health trends
Compare test health across environments