> ## Documentation Index
> Fetch the complete documentation index at: https://docs.testdino.com/llms.txt
> Use this file to discover all available pages before exploring further.
# Playwright Test Run Analytics
> Run speed KPIs, tag health, and branch performance metrics.
**What you'll learn**
* How to track average run time, fastest run, and speed improvements
* How tag health tables compare stability across tag categories
* How to read branch performance and speed distribution charts
## Metrics
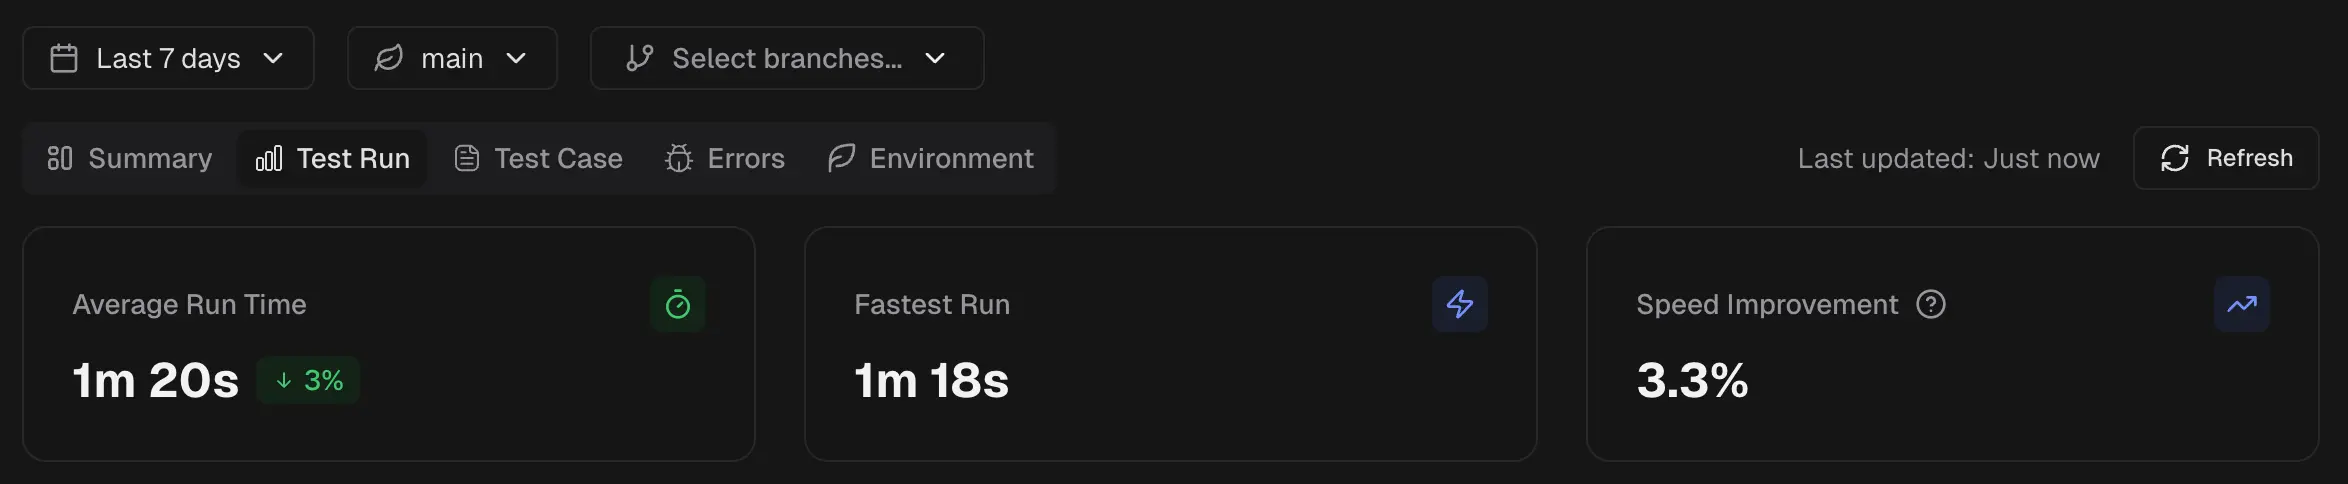
### Average Run Time
Shows the mean duration of all test runs in scope. Indicates the typical time your pipeline requires to complete. Use it as a baseline for tracking daily performance.
### Fastest Run
Displays the shortest single run duration in the selected window. The “Best yet” badge marks a new record relative to previous data in your project.
### Speed Improvement
The percentage decrease in average run time compared to the previous period. A higher positive value means runs are faster than before.
## Tags
A table of all run-level tags used in the selected time period and environment. Use it to compare stability across tag categories such as `regression`, `smoke`, or `release-candidate`.
The table header shows the total number of tags found in the selected period. Use the search box to find a specific tag. Pagination controls appear when the tag list exceeds one page.
| Column | Description |
| :-------- | :-------------------------------------------- |
| Tag | Tag name with a color indicator and link icon |
| Runs | Number of test runs containing this tag |
| Passed | Total passed test count (green) |
| Failed | Total failed test count (red) |
| Flaky | Total flaky test count (yellow) |
| Pass Rate | Overall pass percentage |
Sort by any column to surface the least stable or most-used tags. Click a tag row to open the Test Runs list filtered to that tag.
## Branch Performance
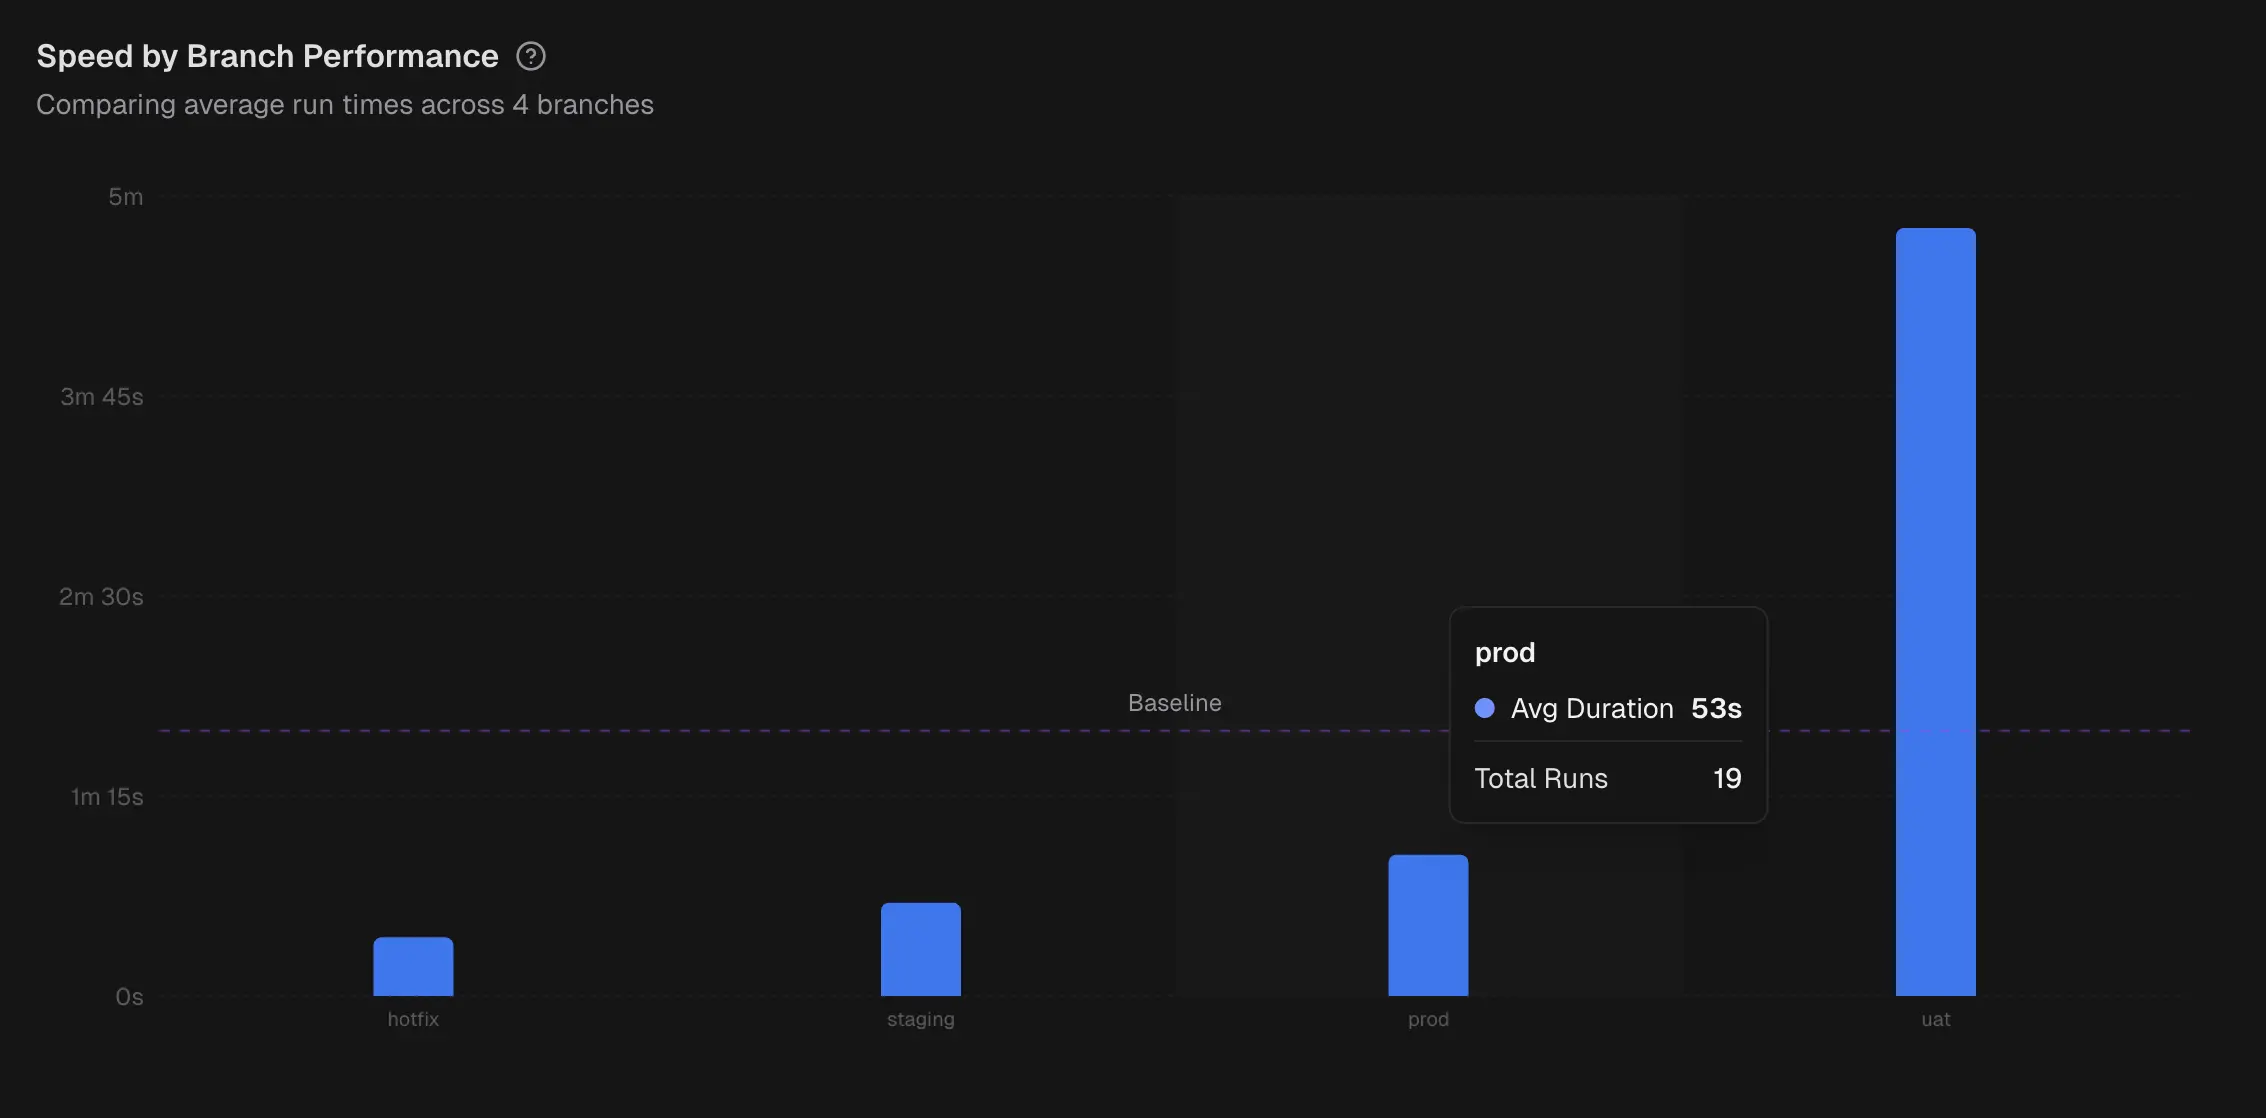
A column chart that compares average test run time across branches. A baseline helps you see which branches are above or below the target. Hover to view each branch’s average duration and test run count.
## Efficiency Trends
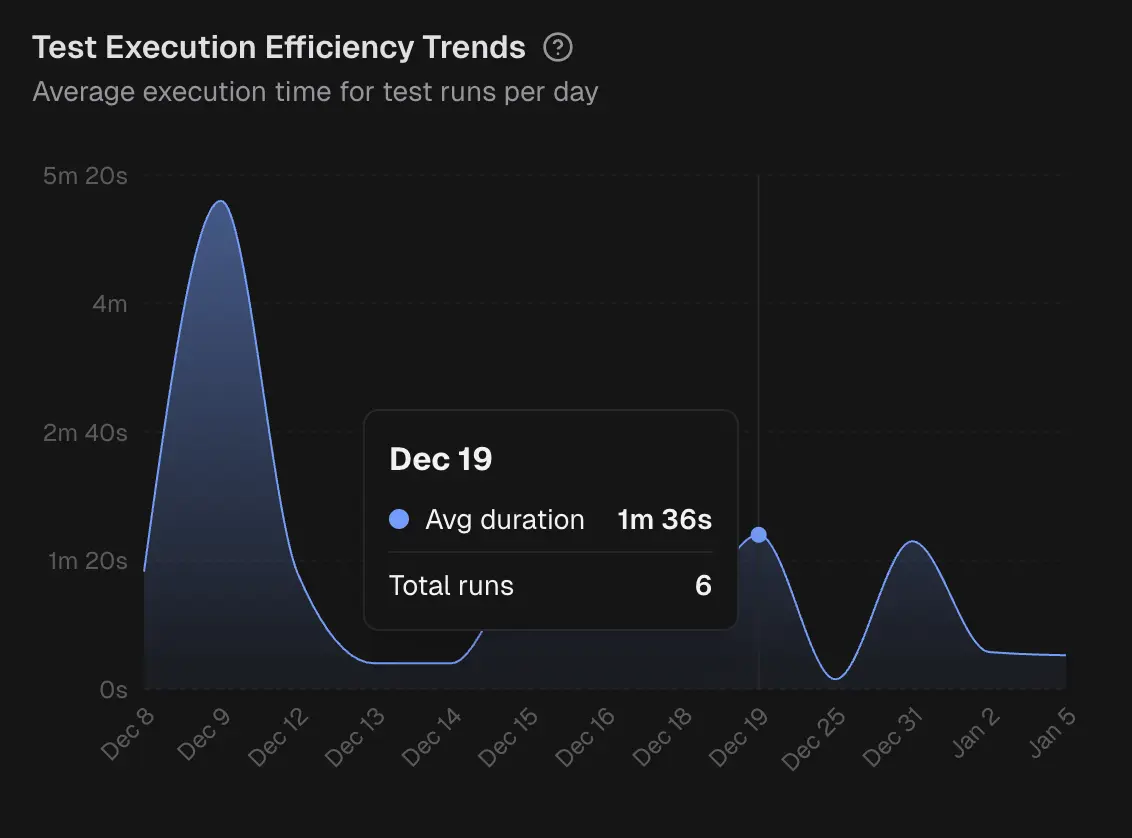 This is an area chart of average run duration per day. Highlights gradual drifts or sudden regressions in runtime. Hover to see the day’s average and test run count.
## Speed Distribution
This is an area chart of average run duration per day. Highlights gradual drifts or sudden regressions in runtime. Hover to see the day’s average and test run count.
## Speed Distribution
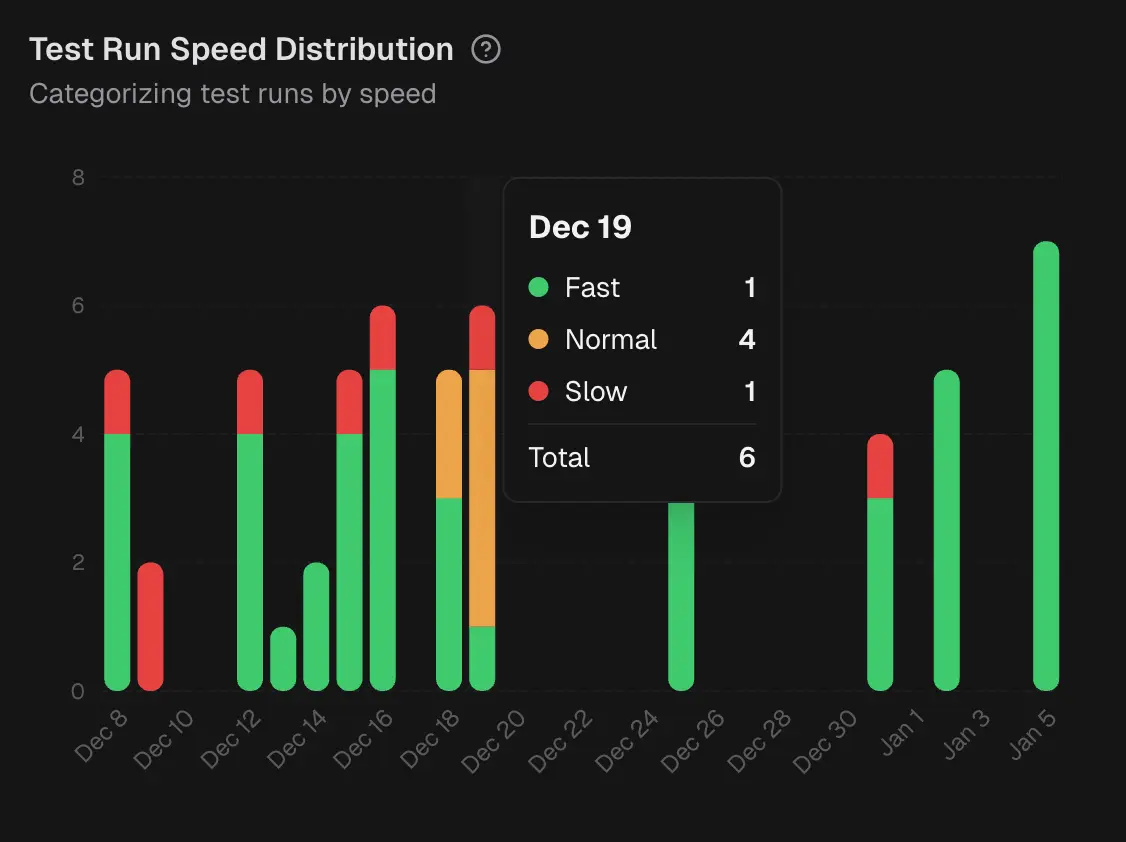 Stacked bars that bucket daily runs into Fast, Normal, and Slow groups based on duration thresholds. Reveals whether slow runs are isolated or common on a given day.