> ## Documentation Index
> Fetch the complete documentation index at: https://docs.testdino.com/llms.txt
> Use this file to discover all available pages before exploring further.
# TestDino Billing and Usage Overview
> Monitor subscription status, plan limits, and test execution usage.
**What you'll learn**
* How to monitor your subscription status and plan limits
* What each usage metric means
* Which features are included in your plan
The Billing & Usage page displays your current subscription, usage metrics, and plan features. Access it from the organization sidebar.
The page contains three tabs: **Usage**, **[Test Limits](/platform/billing-and-usage/test-limits)**, and **[Invoices](/platform/billing-and-usage/invoices)**.
## Usage
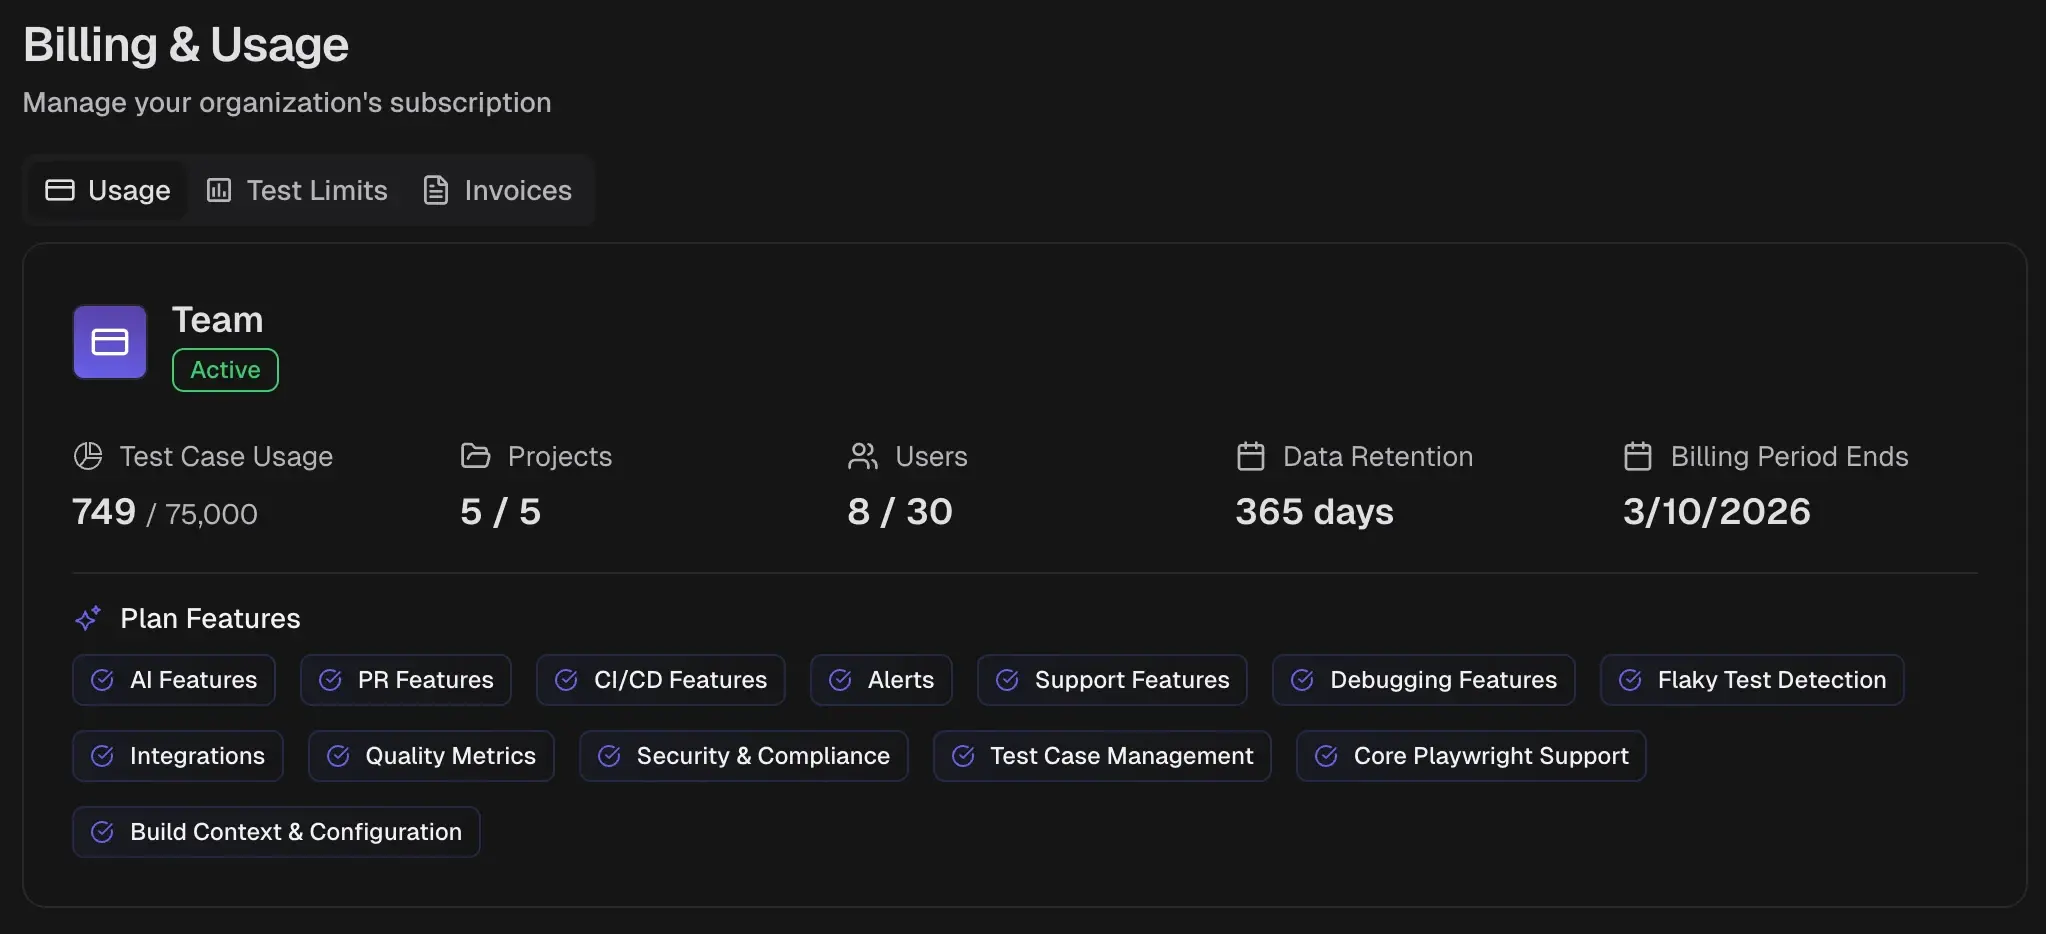 The Usage tab shows your active plan and current consumption at a glance.
### Subscription Card
| Field | Description |
| :------------------ | :-------------------------------------------------------------- |
| Plan | Current plan name (Community, Pro, Team, Enterprise) and status |
| Test Case Usage | Executions consumed vs. monthly limit |
| Projects | Active projects vs. plan limit |
| Users | Organization members vs. plan limit |
| Data Retention | How long test run data is stored |
| Billing Period Ends | Next billing cycle date |
### Plan Features
A feature list shows capabilities included in your current plan. Feature availability varies by plan tier.
| Feature Category | Examples |
| :------------------- | :--------------------------------------- |
| CI/CD Features | GitHub Actions, GitLab CI integration |
| PR Features | Pull request summaries and status checks |
| Debugging Features | Traces, screenshots, video playback |
| Integrations | Jira, Linear, Asana, Slack |
| Quality Metrics | Flaky test detection, error grouping |
| Test Case Management | Manual test case creation and suites |
## Usage Burn-Rate Chart
**Enterprise only.** Visible to org owners and admins on Enterprise plans.
The Usage tab shows your active plan and current consumption at a glance.
### Subscription Card
| Field | Description |
| :------------------ | :-------------------------------------------------------------- |
| Plan | Current plan name (Community, Pro, Team, Enterprise) and status |
| Test Case Usage | Executions consumed vs. monthly limit |
| Projects | Active projects vs. plan limit |
| Users | Organization members vs. plan limit |
| Data Retention | How long test run data is stored |
| Billing Period Ends | Next billing cycle date |
### Plan Features
A feature list shows capabilities included in your current plan. Feature availability varies by plan tier.
| Feature Category | Examples |
| :------------------- | :--------------------------------------- |
| CI/CD Features | GitHub Actions, GitLab CI integration |
| PR Features | Pull request summaries and status checks |
| Debugging Features | Traces, screenshots, video playback |
| Integrations | Jira, Linear, Asana, Slack |
| Quality Metrics | Flaky test detection, error grouping |
| Test Case Management | Manual test case creation and suites |
## Usage Burn-Rate Chart
**Enterprise only.** Visible to org owners and admins on Enterprise plans.
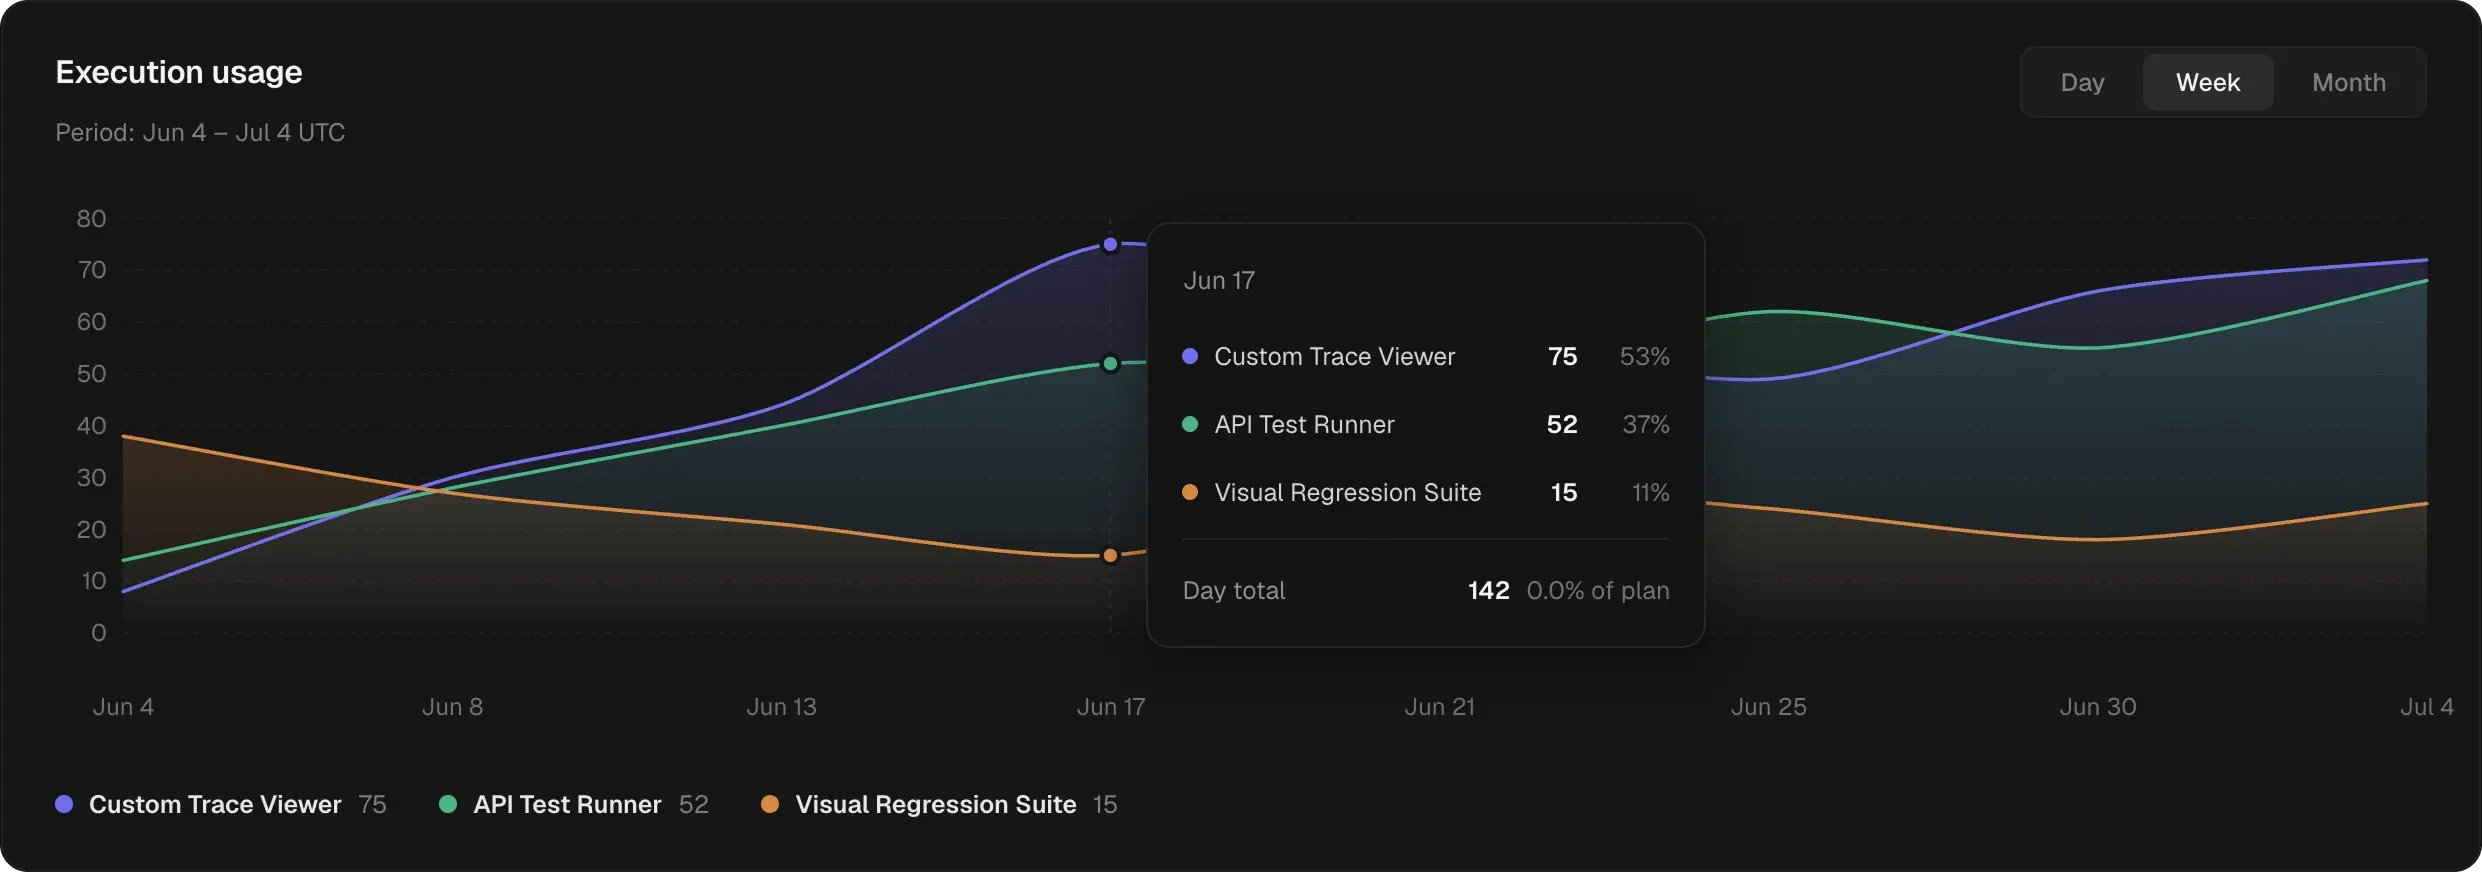 This chart shows your billed test executions over time, stacked per project, below the Subscription card on the **Usage** tab. The dashed line marks your plan limit, so you can see which projects drive consumption and whether you are pacing toward a band change. Switch the Day, Week, or Month tabs to change the time grouping, and hover any bucket to see per-project detail.
It shows three things per bucket:
* **Stacked bands**: Each band is one project. Stack height is total billed executions for that day, week, or month.
* **Plan limit**: The dashed line marks your monthly limit.
* **Legend**: One entry per project with its total executions in the visible range.
## Related
Allocate and redistribute test execution limits across projects
View, download, and filter billing invoices
Configure organization-level preferences
This chart shows your billed test executions over time, stacked per project, below the Subscription card on the **Usage** tab. The dashed line marks your plan limit, so you can see which projects drive consumption and whether you are pacing toward a band change. Switch the Day, Week, or Month tabs to change the time grouping, and hover any bucket to see per-project detail.
It shows three things per bucket:
* **Stacked bands**: Each band is one project. Stack height is total billed executions for that day, week, or month.
* **Plan limit**: The dashed line marks your monthly limit.
* **Legend**: One entry per project with its total executions in the visible range.
## Related
Allocate and redistribute test execution limits across projects
View, download, and filter billing invoices
Configure organization-level preferences