> ## Documentation Index
> Fetch the complete documentation index at: https://docs.testdino.com/llms.txt
> Use this file to discover all available pages before exploring further.
# Playwright Test Explorer in TestDino
> Find failing, flaky, or slow tests across your entire project.
export const VideoSchema = ({name, description, thumbnailUrl, uploadDate, duration, contentUrl, embedUrl}) => {
const schema = {
"@context": "https://schema.org",
"@type": "VideoObject",
name,
description,
thumbnailUrl,
uploadDate,
...duration ? {
duration
} : {},
...contentUrl ? {
contentUrl
} : {},
...embedUrl ? {
embedUrl
} : {},
publisher: {
"@type": "Organization",
name: "TestDino",
logo: {
"@type": "ImageObject",
url: "https://docs.testdino.com/logo/light.svg"
}
}
};
return ;
};
**What you'll learn**
* How to use hierarchical and flat views to find tests
* What each column (failure rate, flaky rate, avg duration, etc.) measures
* How to filter by time period, tags, platforms, and environment
* How the test case detail drawer works
Test Explorer provides a centralized view of all test cases within a project. Analyze test health, track failure patterns, and identify flaky or slow tests across your entire test suite.
## View Modes
Test Explorer supports two viewing modes. Toggle between them using the view switcher in the top-right corner.
### Hierarchical View (Default)
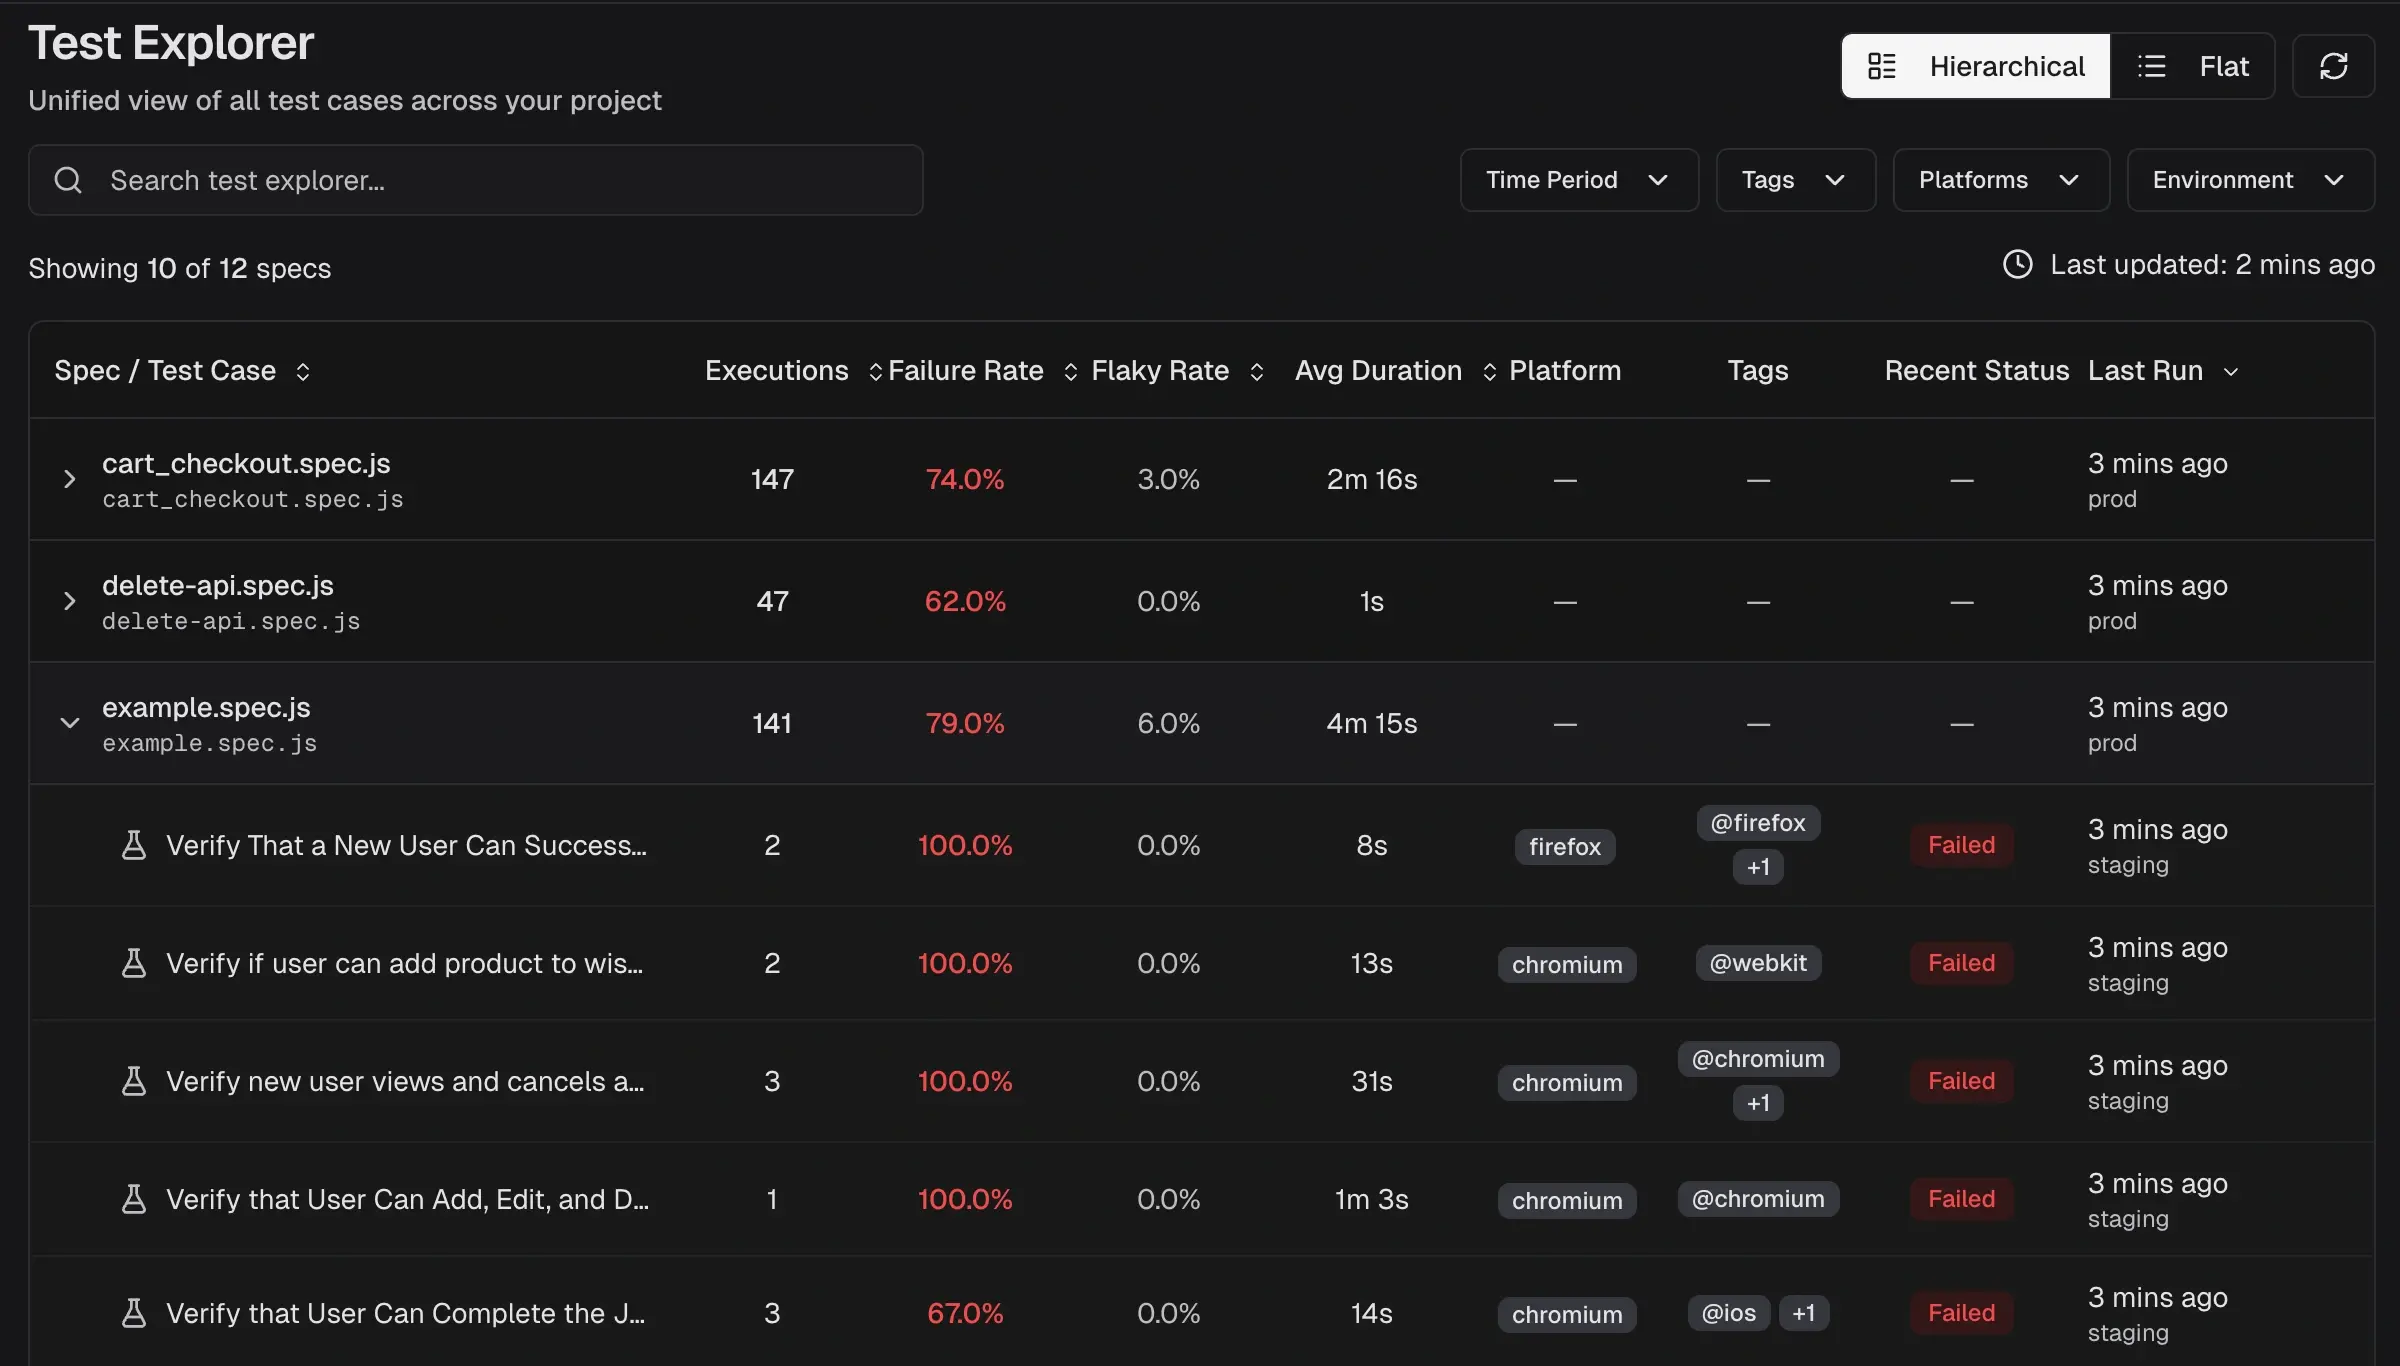
Groups test cases by their spec files. Each spec row displays aggregated metrics across all tests in that file. Expand a spec row to reveal individual test cases within it.
Use this view to identify problematic spec files at a glance, then drill into specific tests.
### Flat View
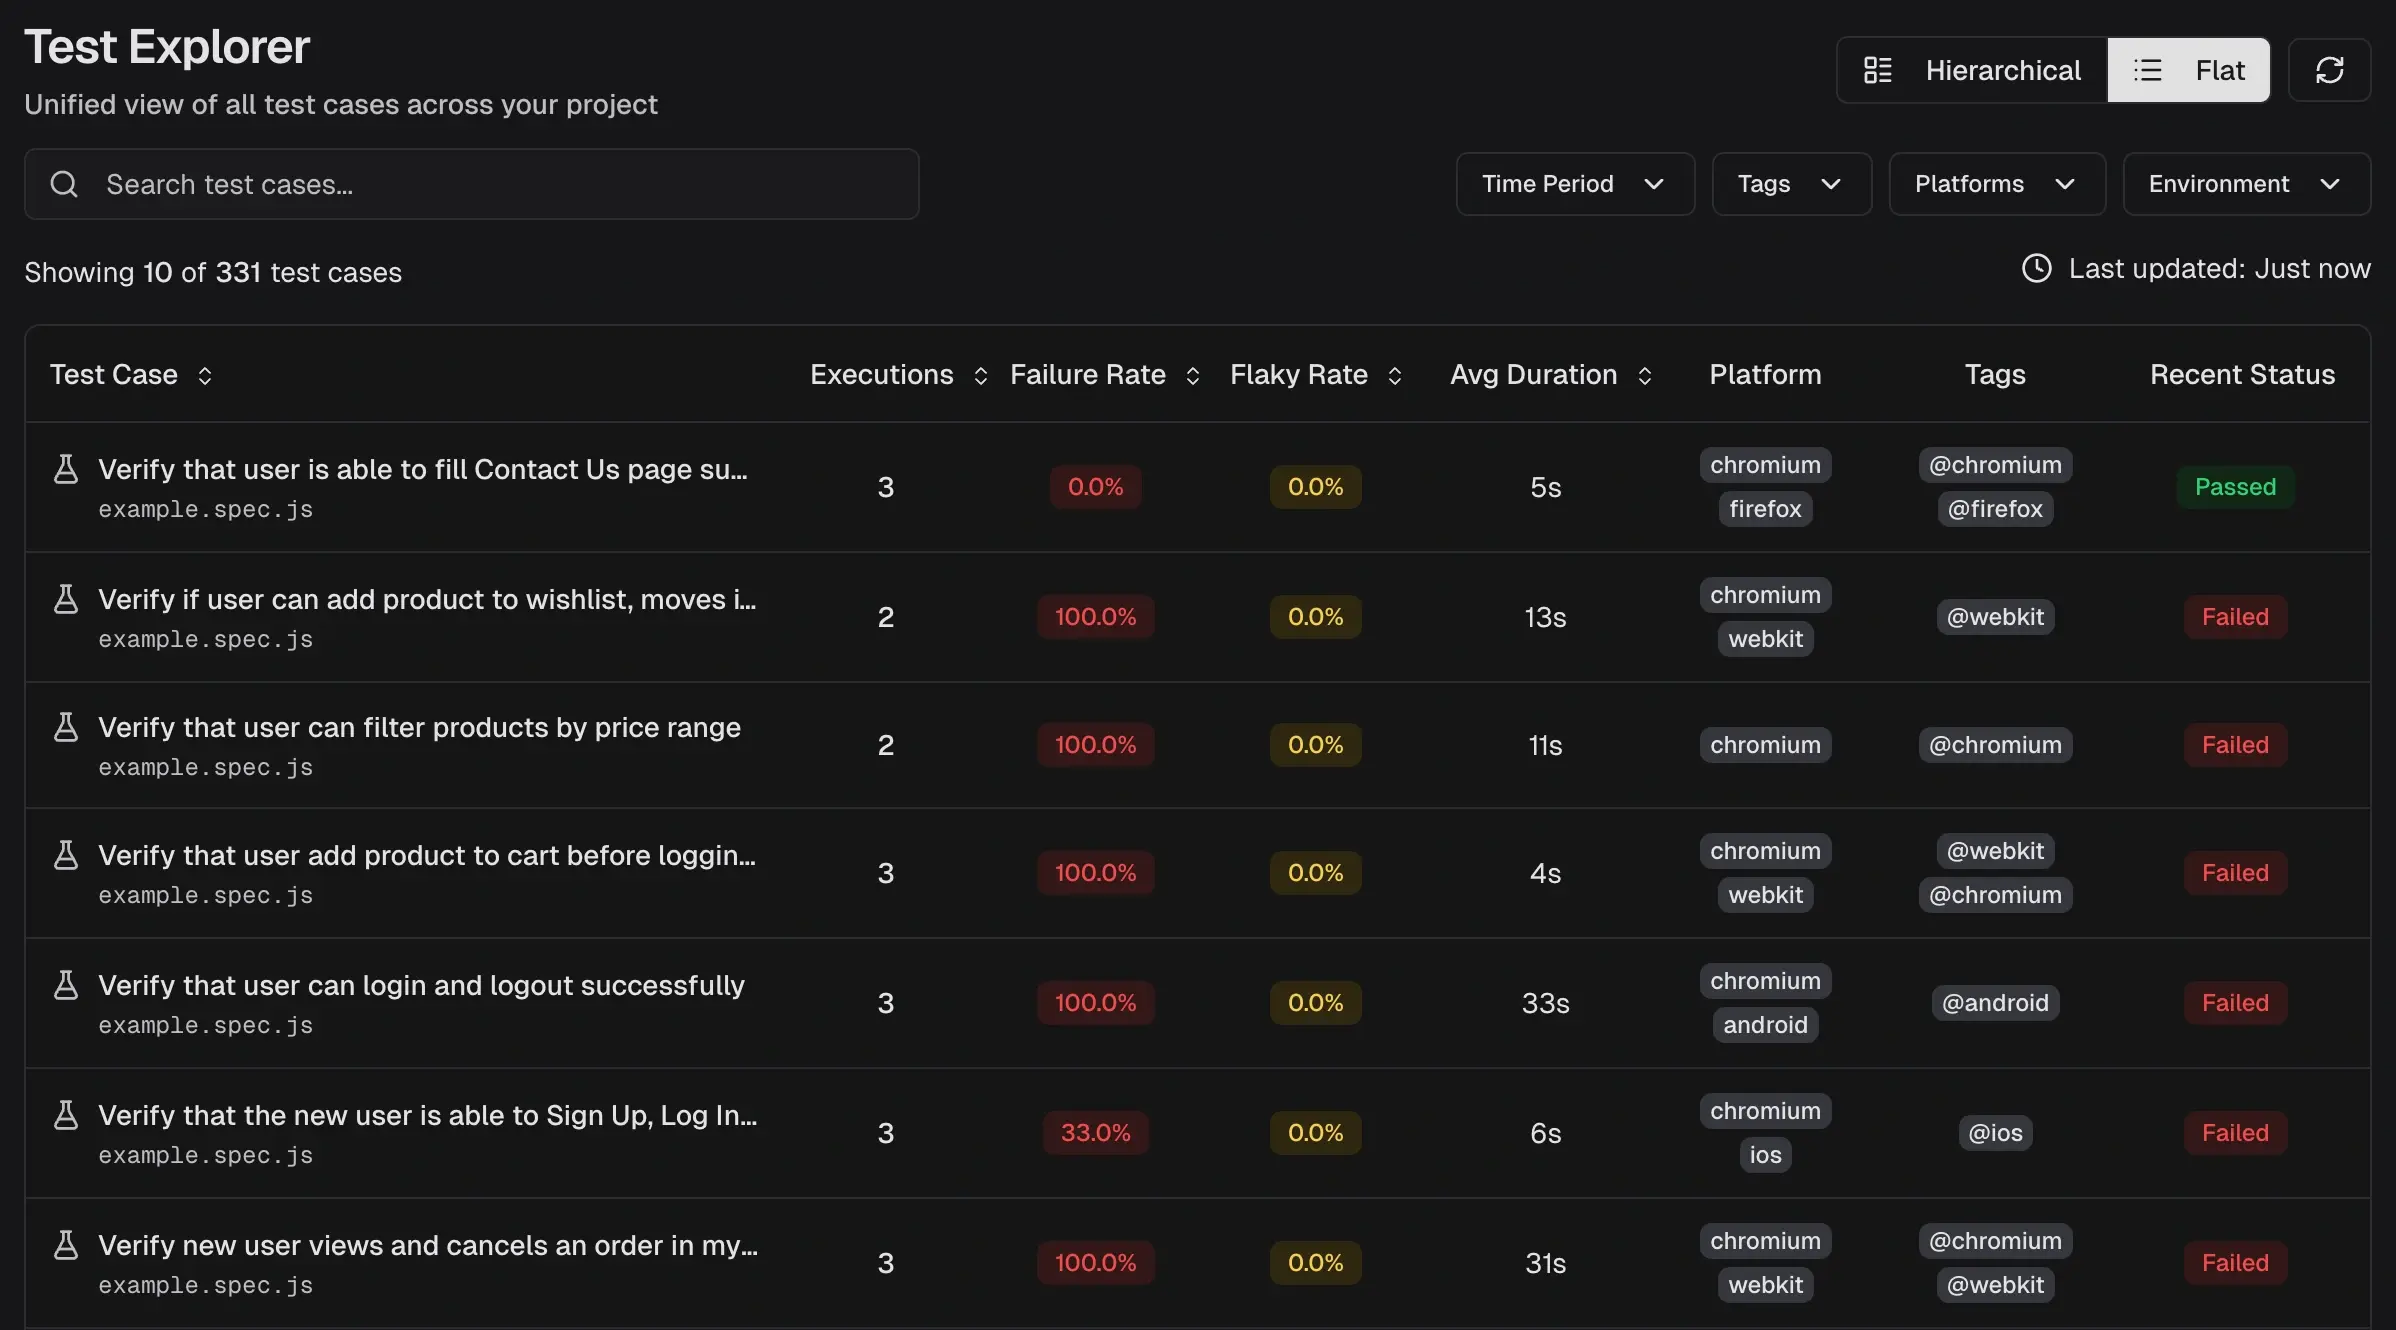
Lists all individual test cases in a single table with per-test metrics. Each row shows the test title, its parent spec file, and execution data.
Use this view when searching for a specific test case or comparing metrics across tests from different spec files.
## Columns
All columns are sortable in both view modes.
| Column | Description |
| :--------------- | :------------------------------------------------------------- |
| Spec / Test Case | File name (hierarchical) or test title with parent spec (flat) |
| Executions | Total runs within the selected time period and filters |
| Failure Rate | Percent of executions with at least one failure |
| Flaky Rate | Percent of executions with at least one flaky result |
| Avg Duration | Average execution time across all runs |
| Platform | Browser or platform used (e.g., chromium, firefox, ios) |
| Tags | Tags associated with the test case |
| Recent Status | Status of the most recent execution (Passed, Failed, Flaky) |
| Last Run | Timestamp of the last execution and the branch it ran on |
## Filters & Search
### Search
Filter by spec file name or test case title using the search bar. Search supports regex for advanced pattern matching.
### Filters
| Filter | Description |
| :---------- | :---------------------------------------------------------------------------------------------------------- |
| Time Period | Scope data to Last 7, 14, 30, 60, or 90 days |
| Tags | Filter by test case tags. See [Test Run Analytics](/platform/analytics/test-run#tags) for tag health trends |
| Platforms | Filter by browser or platform (e.g., chromium, firefox) |
| Environment | Filter by target environment (e.g., staging, production) |
Activating filters updates the results count and table data immediately.
### Sync
Click the sync button (top-right) to refresh data without reloading the page.
## Detail Drawer
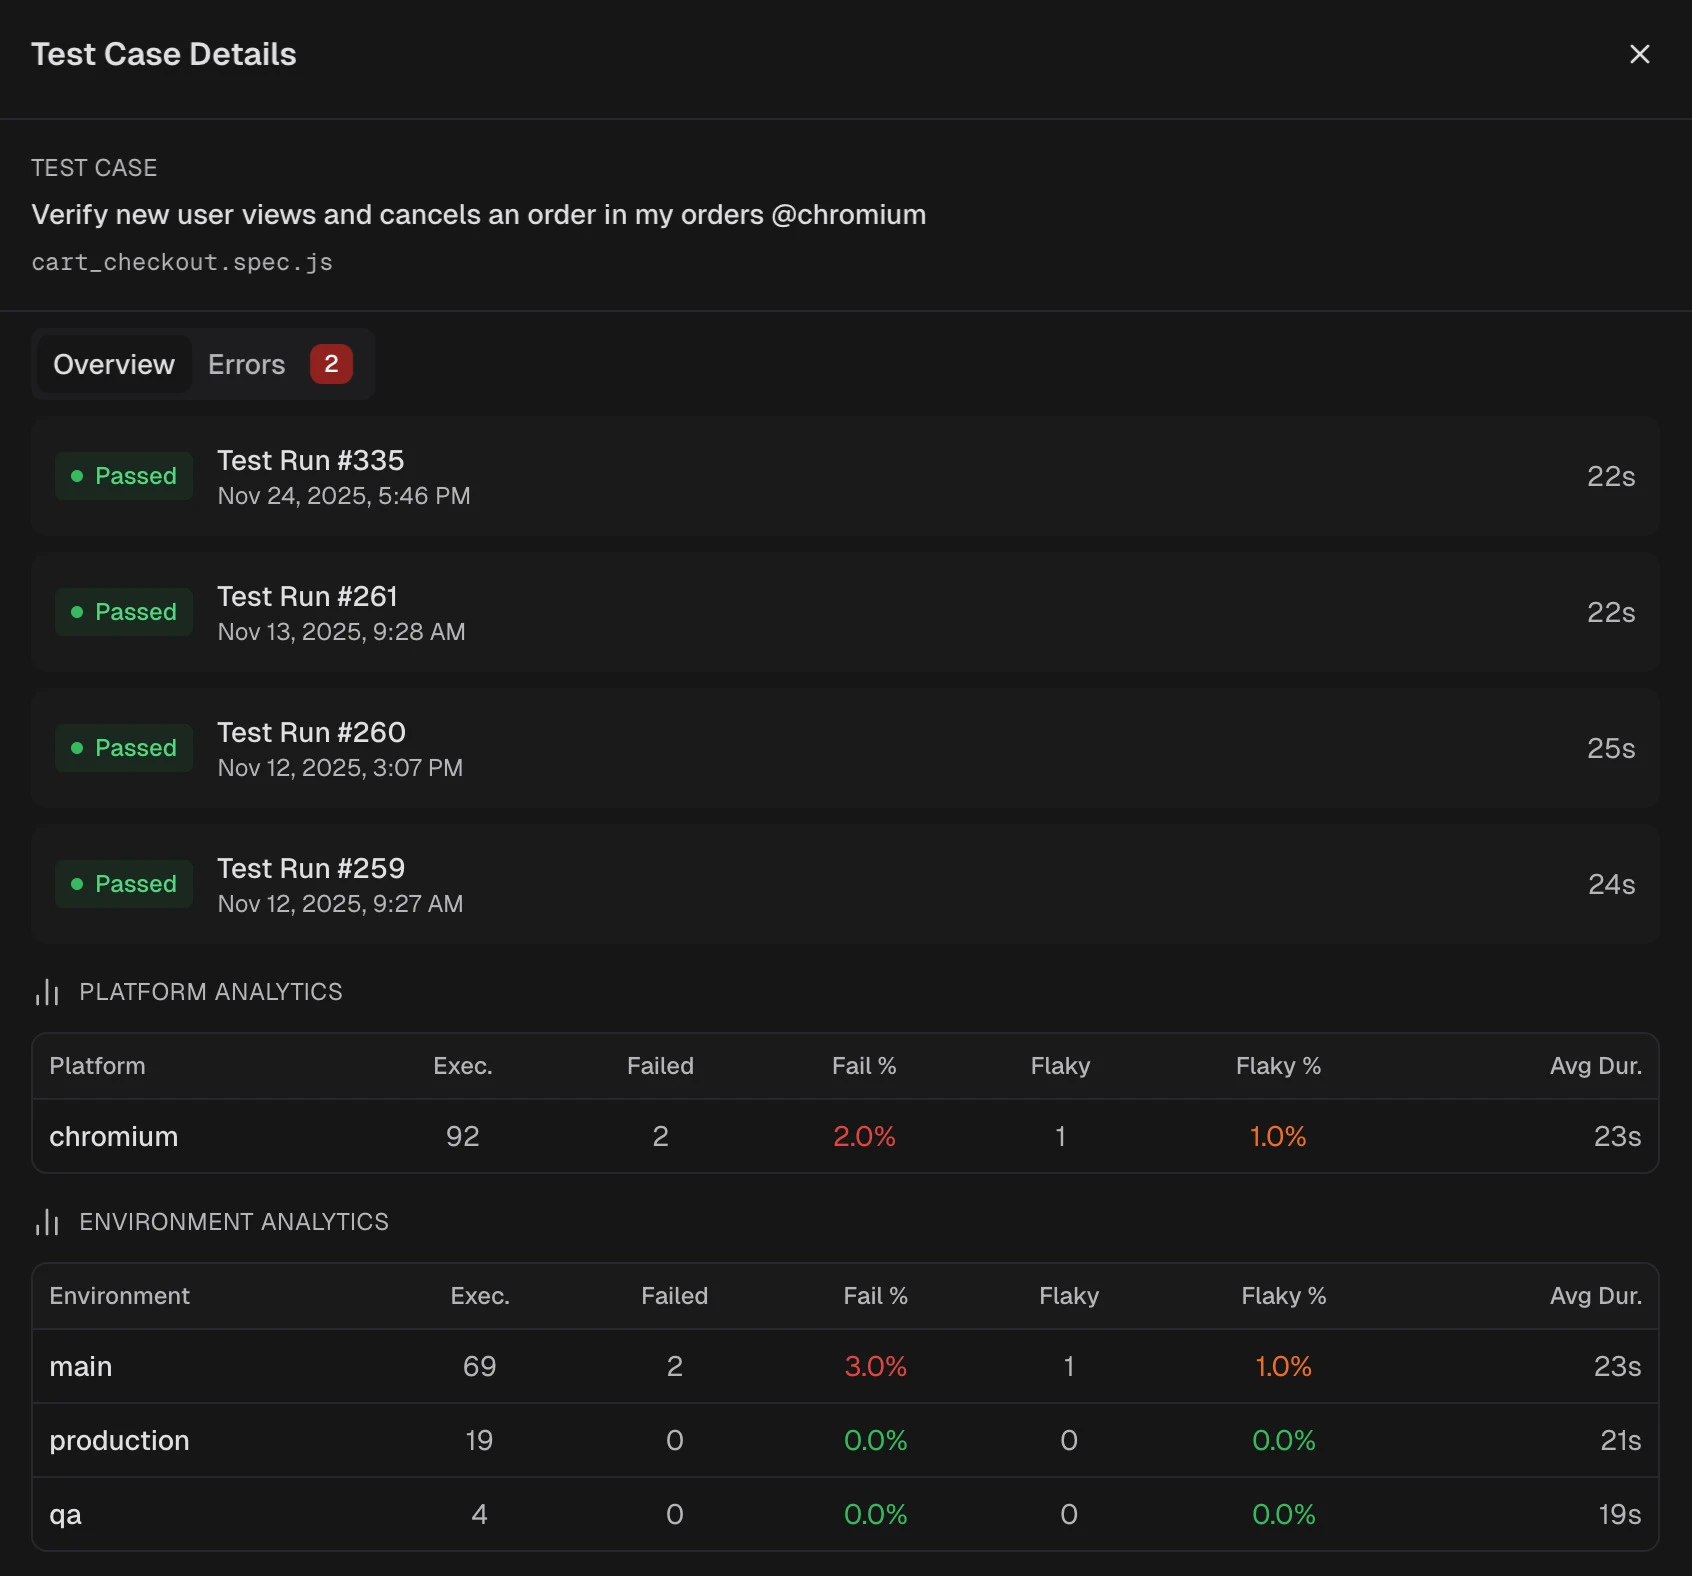
Click any test case row to open the details drawer. The drawer contains two tabs.
### Overview Tab
* **Test Run History** displays the most recent executions with status, timestamp, and duration. Click a run to open the full [test run details](/platform/playwright-test-runs) page.
* **Platform Analytics** breaks down executions, failures, flaky count, and average duration by browser or platform.
* **Environment Analytics** shows the same breakdown by environment (e.g., production, staging).
### Errors Tab
Displays unique error messages aggregated across all executions of the test case. Each error entry shows:
| Field | Description |
| :------------ | :--------------------------------------- |
| First seen | Timestamp of the earliest occurrence |
| Last seen | Timestamp of the most recent occurrence |
| Count | Total number of times the error occurred |
| Error message | Full error text with stack trace context |
Use the Errors tab to identify recurring failures and track whether fixes have resolved them.
## Get Started
1. **Set scope.** Use Time Period and Environment filters to narrow the dataset.
2. **Identify targets.** Sort by Failure Rate or Flaky Rate to surface unstable tests. Sort by Avg Duration to find slow tests.
3. **Switch views.** Use Hierarchical view to find problematic spec files, then Flat view to compare individual tests across files.
4. **Inspect details.** Click a test case to view execution history, platform breakdowns, and error patterns.
## Pagination
Large datasets load in pages. Click **Load More Specs** (hierarchical) or **Load More Test Cases** (flat) at the bottom of the table to fetch the next batch.
## Related
View all test executions
Manage and organize test cases
Project-wide test analytics
Detect and fix flaky tests
 Use this view to identify problematic spec files at a glance, then drill into specific tests.
### Flat View
Lists all individual test cases in a single table with per-test metrics. Each row shows the test title, its parent spec file, and execution data.
Use this view to identify problematic spec files at a glance, then drill into specific tests.
### Flat View
Lists all individual test cases in a single table with per-test metrics. Each row shows the test title, its parent spec file, and execution data.
 Use this view when searching for a specific test case or comparing metrics across tests from different spec files.
## Columns
All columns are sortable in both view modes.
| Column | Description |
| :--------------- | :------------------------------------------------------------- |
| Spec / Test Case | File name (hierarchical) or test title with parent spec (flat) |
| Executions | Total runs within the selected time period and filters |
| Failure Rate | Percent of executions with at least one failure |
| Flaky Rate | Percent of executions with at least one flaky result |
| Avg Duration | Average execution time across all runs |
| Platform | Browser or platform used (e.g., chromium, firefox, ios) |
| Tags | Tags associated with the test case |
| Recent Status | Status of the most recent execution (Passed, Failed, Flaky) |
| Last Run | Timestamp of the last execution and the branch it ran on |
## Filters & Search
### Search
Filter by spec file name or test case title using the search bar. Search supports regex for advanced pattern matching.
### Filters
| Filter | Description |
| :---------- | :---------------------------------------------------------------------------------------------------------- |
| Time Period | Scope data to Last 7, 14, 30, 60, or 90 days |
| Tags | Filter by test case tags. See [Test Run Analytics](/platform/analytics/test-run#tags) for tag health trends |
| Platforms | Filter by browser or platform (e.g., chromium, firefox) |
| Environment | Filter by target environment (e.g., staging, production) |
Activating filters updates the results count and table data immediately.
### Sync
Click the sync button (top-right) to refresh data without reloading the page.
## Detail Drawer
Click any test case row to open the details drawer. The drawer contains two tabs.
Use this view when searching for a specific test case or comparing metrics across tests from different spec files.
## Columns
All columns are sortable in both view modes.
| Column | Description |
| :--------------- | :------------------------------------------------------------- |
| Spec / Test Case | File name (hierarchical) or test title with parent spec (flat) |
| Executions | Total runs within the selected time period and filters |
| Failure Rate | Percent of executions with at least one failure |
| Flaky Rate | Percent of executions with at least one flaky result |
| Avg Duration | Average execution time across all runs |
| Platform | Browser or platform used (e.g., chromium, firefox, ios) |
| Tags | Tags associated with the test case |
| Recent Status | Status of the most recent execution (Passed, Failed, Flaky) |
| Last Run | Timestamp of the last execution and the branch it ran on |
## Filters & Search
### Search
Filter by spec file name or test case title using the search bar. Search supports regex for advanced pattern matching.
### Filters
| Filter | Description |
| :---------- | :---------------------------------------------------------------------------------------------------------- |
| Time Period | Scope data to Last 7, 14, 30, 60, or 90 days |
| Tags | Filter by test case tags. See [Test Run Analytics](/platform/analytics/test-run#tags) for tag health trends |
| Platforms | Filter by browser or platform (e.g., chromium, firefox) |
| Environment | Filter by target environment (e.g., staging, production) |
Activating filters updates the results count and table data immediately.
### Sync
Click the sync button (top-right) to refresh data without reloading the page.
## Detail Drawer
Click any test case row to open the details drawer. The drawer contains two tabs.
 ### Overview Tab
* **Test Run History** displays the most recent executions with status, timestamp, and duration. Click a run to open the full [test run details](/platform/playwright-test-runs) page.
* **Platform Analytics** breaks down executions, failures, flaky count, and average duration by browser or platform.
* **Environment Analytics** shows the same breakdown by environment (e.g., production, staging).
### Errors Tab
Displays unique error messages aggregated across all executions of the test case. Each error entry shows:
| Field | Description |
| :------------ | :--------------------------------------- |
| First seen | Timestamp of the earliest occurrence |
| Last seen | Timestamp of the most recent occurrence |
| Count | Total number of times the error occurred |
| Error message | Full error text with stack trace context |
Use the Errors tab to identify recurring failures and track whether fixes have resolved them.
## Get Started
1. **Set scope.** Use Time Period and Environment filters to narrow the dataset.
2. **Identify targets.** Sort by Failure Rate or Flaky Rate to surface unstable tests. Sort by Avg Duration to find slow tests.
3. **Switch views.** Use Hierarchical view to find problematic spec files, then Flat view to compare individual tests across files.
4. **Inspect details.** Click a test case to view execution history, platform breakdowns, and error patterns.
## Pagination
Large datasets load in pages. Click **Load More Specs** (hierarchical) or **Load More Test Cases** (flat) at the bottom of the table to fetch the next batch.
## Related
### Overview Tab
* **Test Run History** displays the most recent executions with status, timestamp, and duration. Click a run to open the full [test run details](/platform/playwright-test-runs) page.
* **Platform Analytics** breaks down executions, failures, flaky count, and average duration by browser or platform.
* **Environment Analytics** shows the same breakdown by environment (e.g., production, staging).
### Errors Tab
Displays unique error messages aggregated across all executions of the test case. Each error entry shows:
| Field | Description |
| :------------ | :--------------------------------------- |
| First seen | Timestamp of the earliest occurrence |
| Last seen | Timestamp of the most recent occurrence |
| Count | Total number of times the error occurred |
| Error message | Full error text with stack trace context |
Use the Errors tab to identify recurring failures and track whether fixes have resolved them.
## Get Started
1. **Set scope.** Use Time Period and Environment filters to narrow the dataset.
2. **Identify targets.** Sort by Failure Rate or Flaky Rate to surface unstable tests. Sort by Avg Duration to find slow tests.
3. **Switch views.** Use Hierarchical view to find problematic spec files, then Flat view to compare individual tests across files.
4. **Inspect details.** Click a test case to view execution history, platform breakdowns, and error patterns.
## Pagination
Large datasets load in pages. Click **Load More Specs** (hierarchical) or **Load More Test Cases** (flat) at the bottom of the table to fetch the next batch.
## Related