> ## Documentation Index
> Fetch the complete documentation index at: https://docs.testdino.com/llms.txt
> Use this file to discover all available pages before exploring further.
# Playwright Pull Request Test Overview
> Assess pull request health with test KPIs, trends, and AI insights.
**What you'll learn**
* How to assess PR health from KPI tiles and test trends
* What the latest test run card reveals
* How to use AI-generated insights for root cause analysis
The Overview tab shows the current status of a pull request. Assess PR health and decide whether to review, rerun, or fix.
## PR Header
The header displays the primary context for the PR:
* **PR Title and Number:** Name and unique identifier
* **Status Badge:** Current state (Open, Draft, Merged, Closed)
* **View PR Link:** Direct link to the PR in GitHub or merge request in GitLab
* **Branch Information:** Source and target branches
* **Timestamp:** Time of last update or creation
## Sidebar
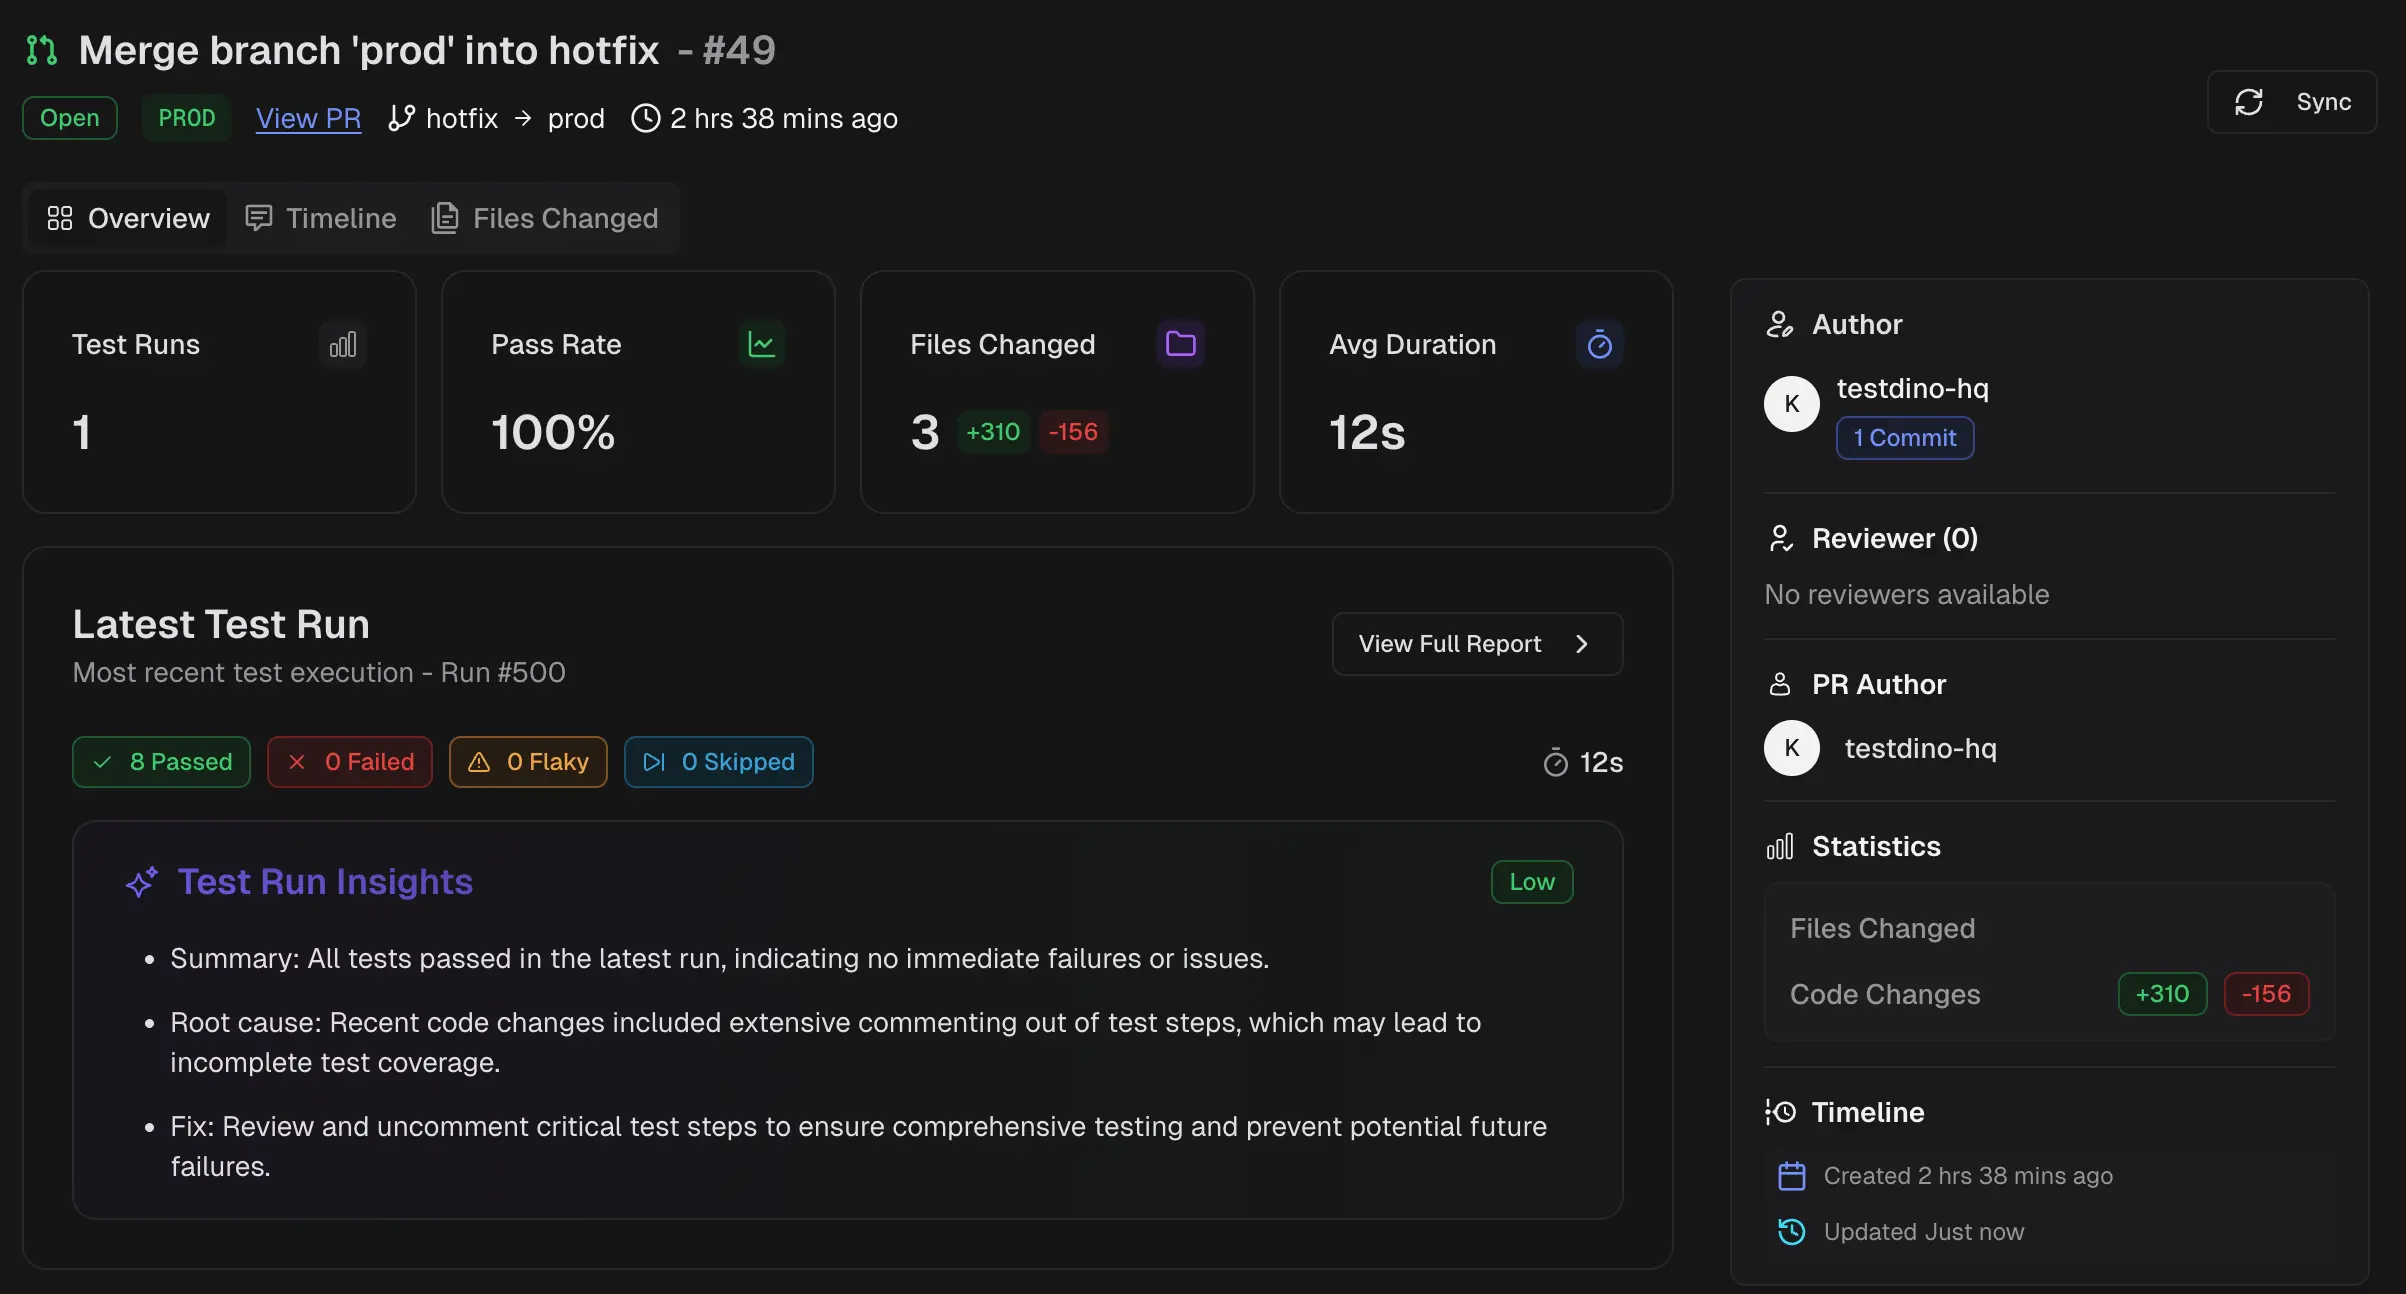
A panel displaying PR metadata and activity:
* Author, reviewer(s), and assignees
* Total files changed
* Aggregate code changes (additions and deletions)
* Created and last updated timestamps
## KPI Tiles
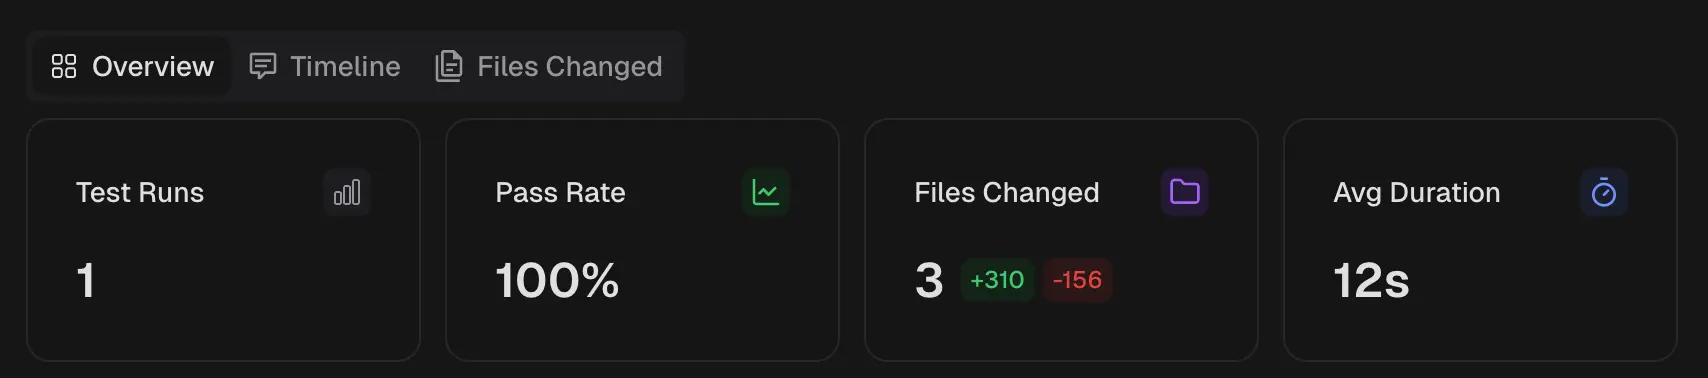
Four metrics summarizing PR activity:
| Tile | Description |
| ---------------- | ---------------------------------------------- |
| Test Runs | Total number of test runs executed for this PR |
| Pass Rate | Aggregate pass rate across all test runs |
| Files Changed | Total lines added and deleted |
| Average Duration | Average execution time per test run |
## Latest Test Run
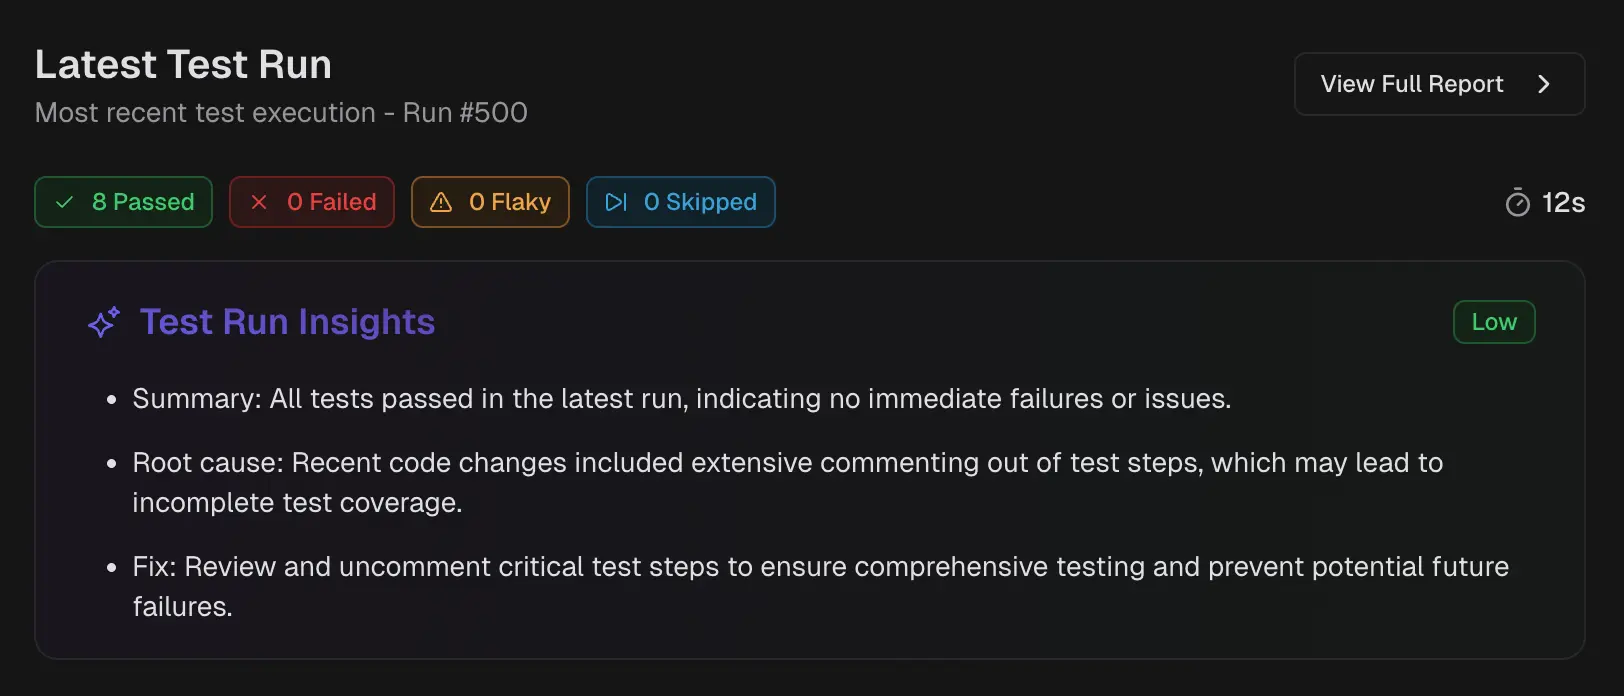
This card shows results from the most recent test execution:
* **Status Counts:** Passed, failed, flaky, and skipped tests for this run
* **Duration:** Execution time for this specific run
**Tip**
Select **View full report** to open the full run detail for that execution.
## Test Results Trend
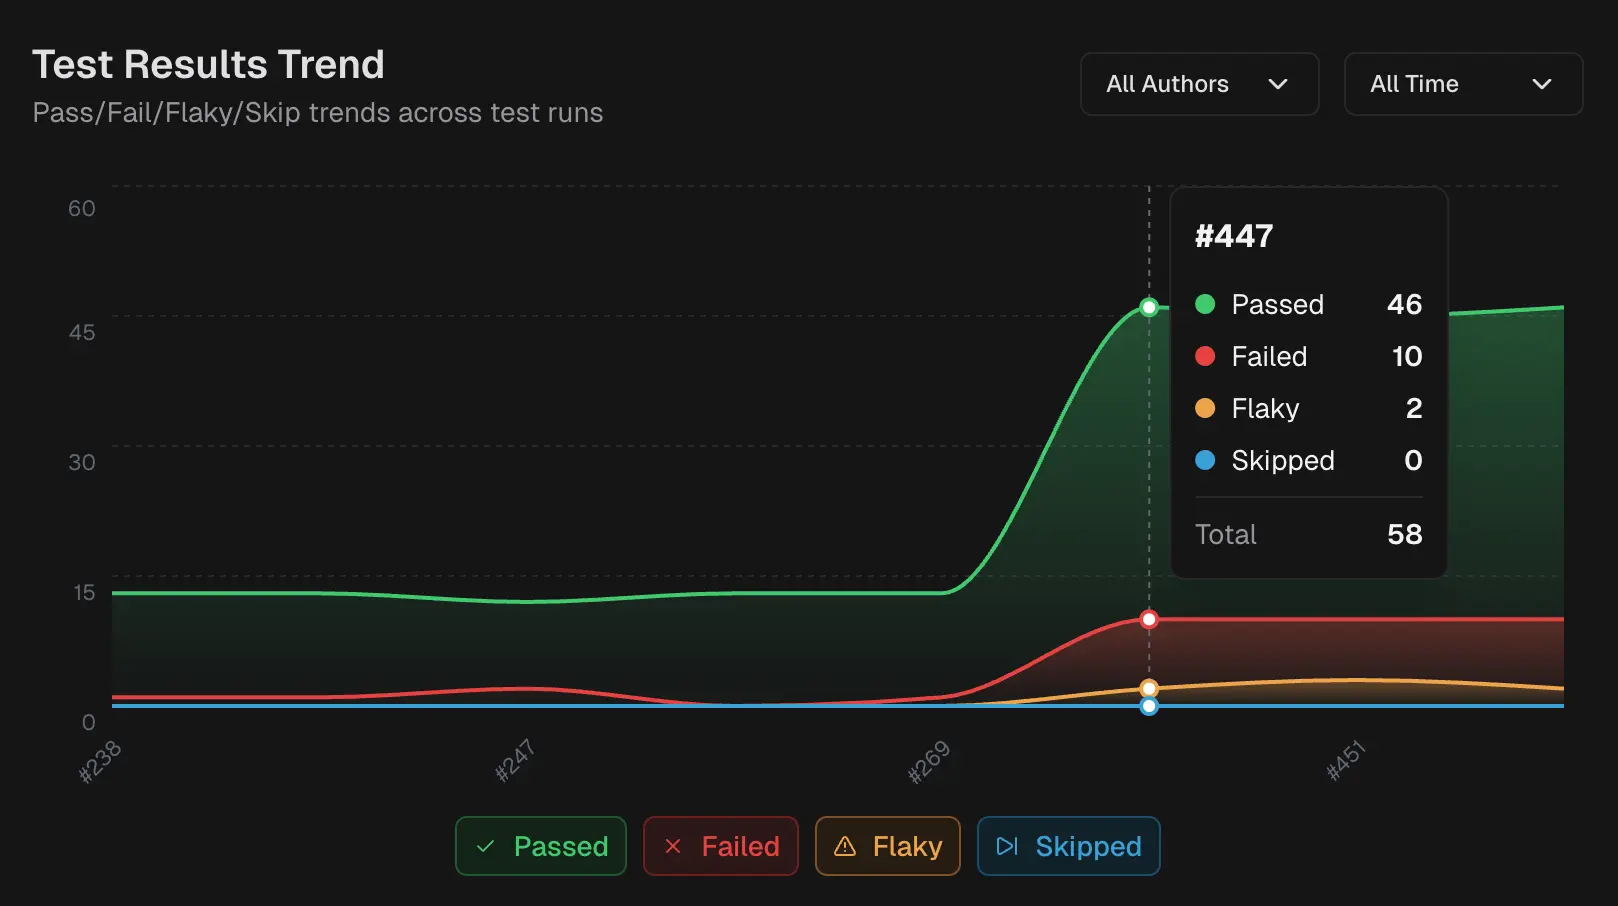
A graph showing test results across all runs for this PR:
* **Trend Graph:** Plots passed, failed, flaky, and skipped counts over time
* **Interactive Tooltip:** Hover over any point to see exact counts for that run
**Tip**
Use the **filters** to change the scope by **Author** or **time period** (Last 7 runs, Last 14 runs).
## Related
Chronological log of commits, test runs, and review activity
Review code diffs and modifications inside TestDino
View detailed test run results and analysis