Pull Requests
TestDino’s Pull Requests view lists all your PRs with their latest runs. From this list, you can click any PR to open a detailed view that organizes all associated data—test results, commit history, PR/code comments, reviewer status, and code changes into three tabs: Overview, Timeline, and Files Changed.
Use this page to identify blockers at a glance and drill down into the complete context of any change.
Why this view matters
-
Run context at a glance - In the PR view, examine the latest test runs and their detailed statistics, including run ID, start time, duration, and the counts for passed, failed, flaky, and skipped tests alongside AI-generated insights.
-
Open for proof - Click a row to open the run with failure clusters, specs, logs, screenshots, trace, and console output.
-
History you can verify - Expand a PR to view all test runs and confirm whether retries or fixes stabilized the tests.
-
Fast handoff - Jump from a PR to the failing run or test case to file an issue or continue triage.
-
Centralized PR Context: Access a tabbed interface that combines test health (Overview), commit history, testruns, PR/code comments (Timeline), and code diffs (Files Changed) in one place.
-
Code Review in Context: Review code changes directly in the Files Changed tab.
-
Historical Analysis: Use the Timeline tab to trace which commits led to specific test failures or fixes.
Layout
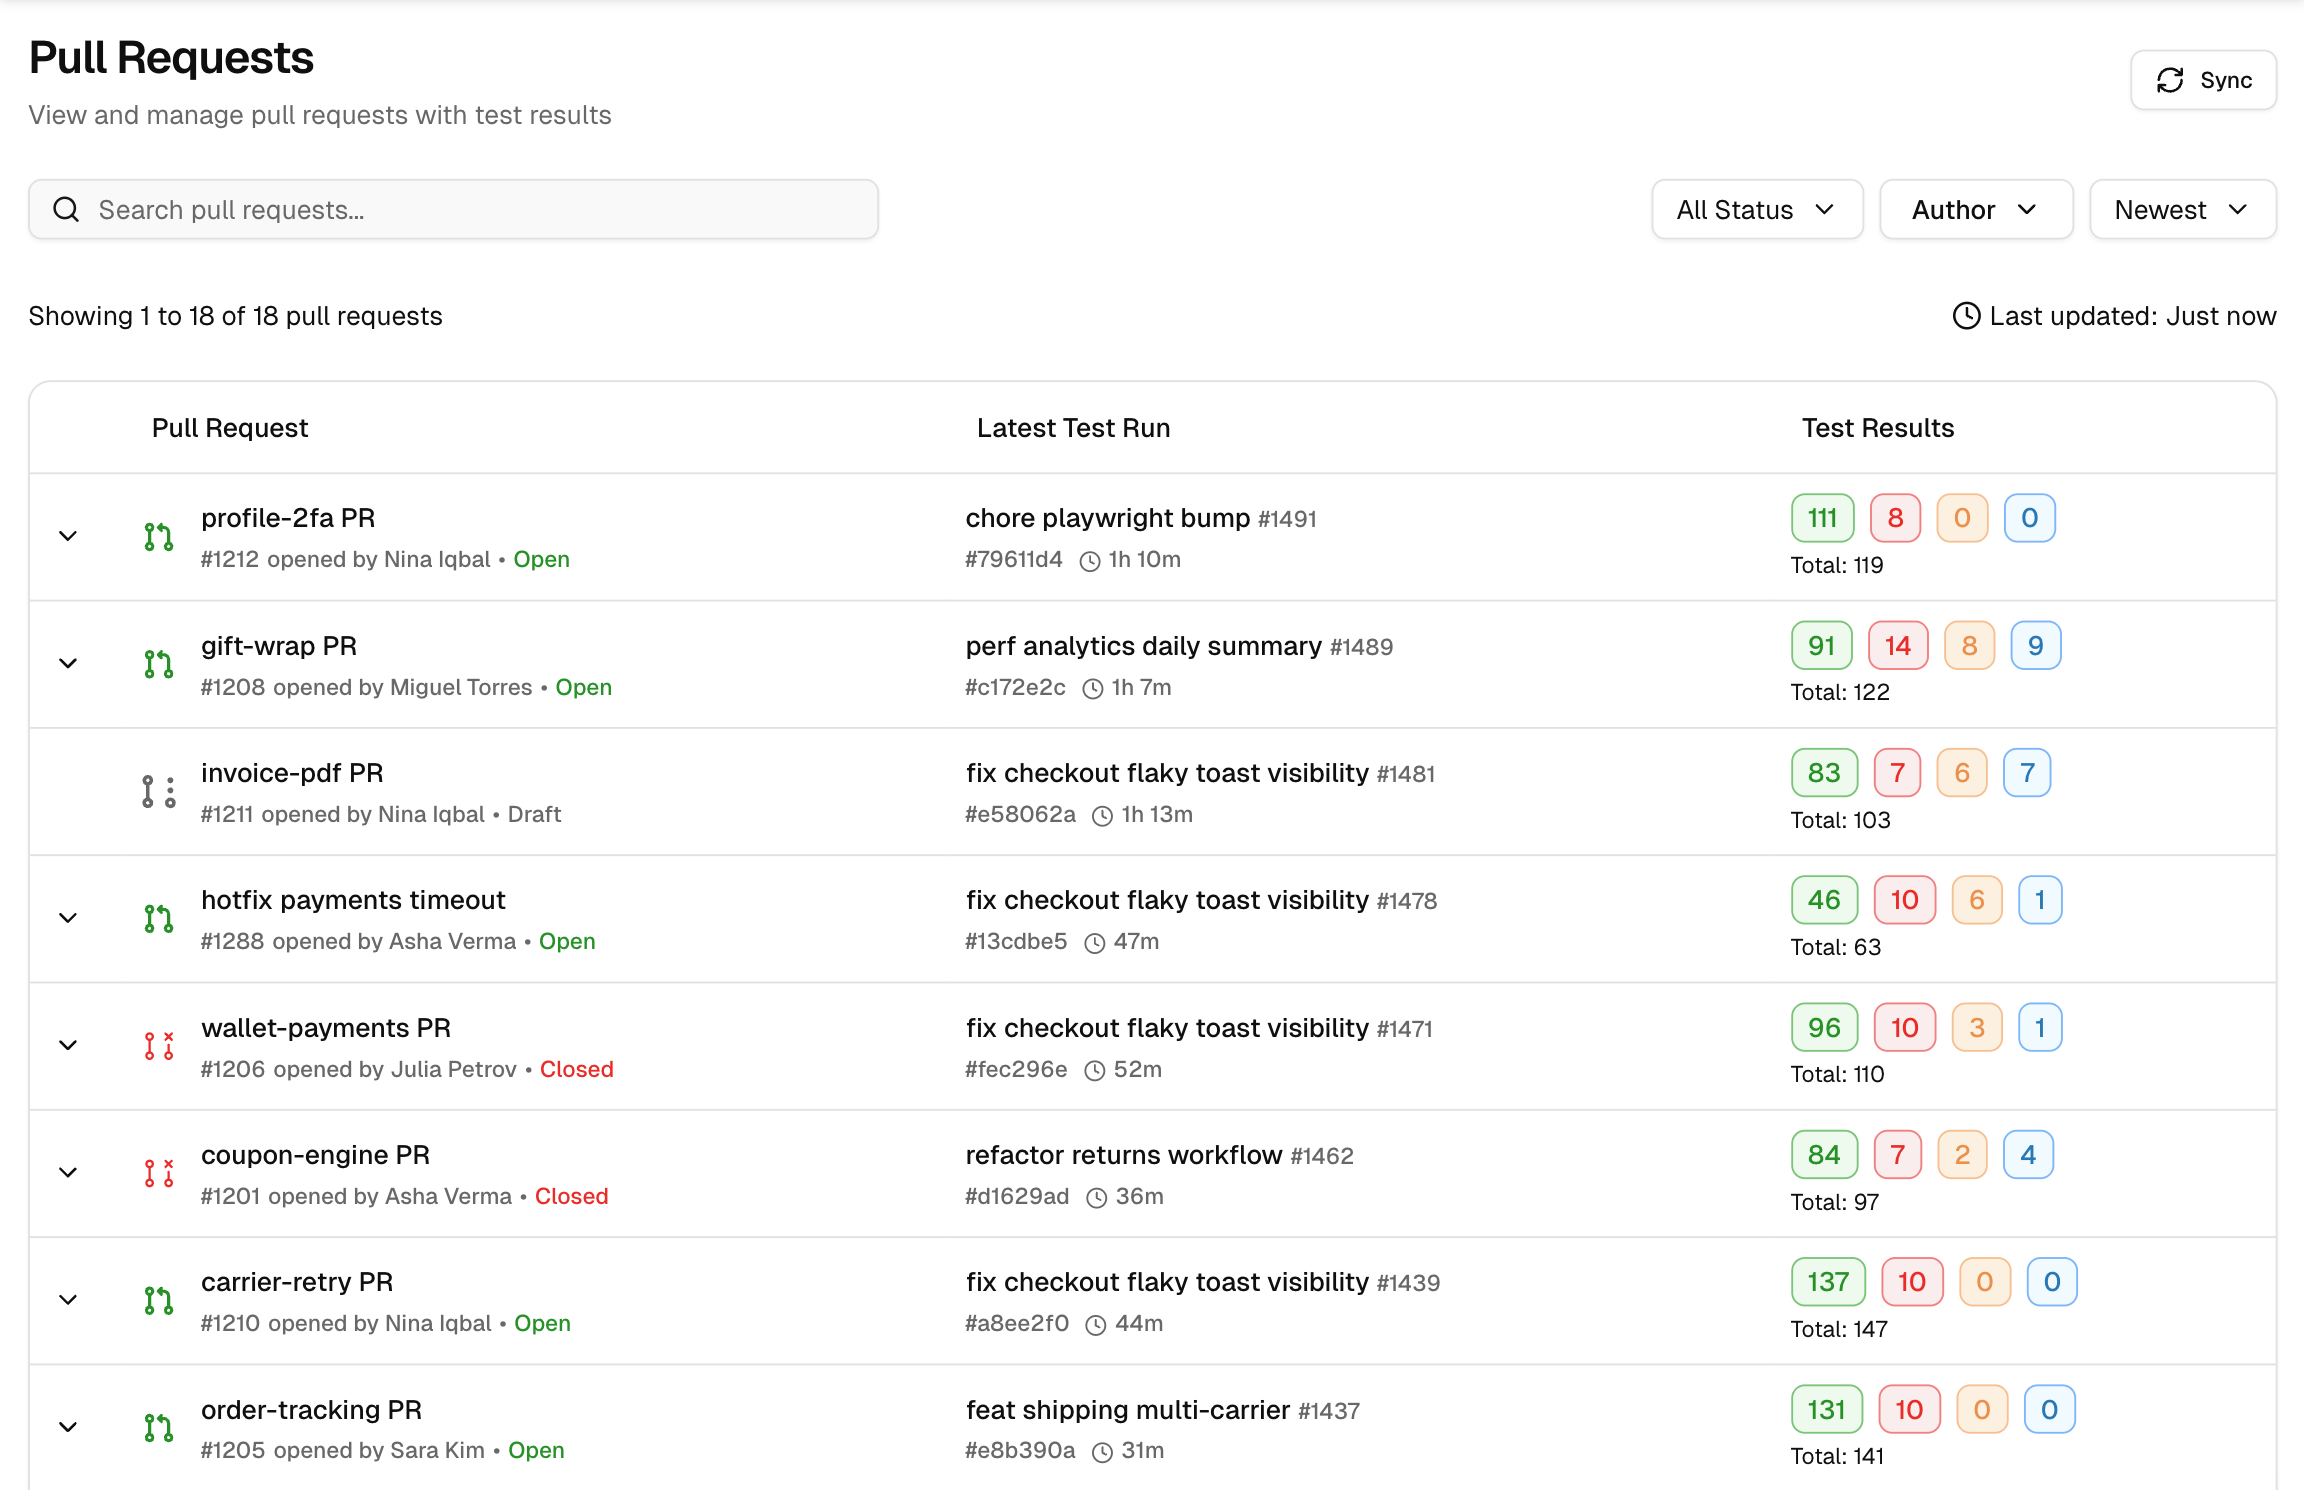
1. Pull Request
Shows the PR title, number, author, and a state badge (Open, Closed, Merged, Draft).
You can click the title to open the PR in your CI/CD Pipeline. The badge indicates whether the PR still requires review (Open/Draft) or has been completed (Merged/Closed).
-
Open - Active PR under review. New commits trigger runs; results update here.
-
Draft - Work in progress. Checks may run, but the PR is not ready to merge.
-
Merged - Changes have been integrated into the base branch. The page retains the history for reference.
-
Closed - PR closed without merging (or after a revert). History remains; no new runs are triggered.
2. Latest Test Run
Displays the most recent run tied to the PR, with run ID, start time, and duration. Click a Test Run to see its detailed view.
3. Test Results
Compact counts for Passed, Failed, Flaky, and Skipped. Use these numbers to verify risky PRs in seconds and decide whether to review, fix, or rerun.
4. Row Expander
Expand a PR to see the full run history. Each entry lists the run ID, timestamp, duration, and result badges, allowing you to confirm whether a fix reduces failures or if flakiness persists.
5. Filters and Controls
Search by PR title or number. Filter by Status and Author to focus the list. Sort by Newest (or other order) and use Sync to refresh with the latest runs.
Quick start steps
1. Set scope
Filter the PR list by Status and Author. By default, drafts and open PR are displayed.
2. Scan rows
Check the Latest Test Run and Test Results columns to judge risk.
3. Open PR Detail View
Click any PR row to open the detailed view.
4. Analyze Context
Use the Overview, Timeline, and Files Changed tabs to investigate test health, commit history, and code diffs.
What you get beyond GitHub
-
Test-aware list. In the Timeline Tab, view all test runs per PR, including pass/fail/flaky counts in the table, without needing to open CI pages.
-
Actionable triage in one place. Jump from a PR row straight to the full test run detail and create Jira/Linear/Asana issues from there (see Integrations).
-
Flaky and regression detection. View run-to-run patterns for the same PR to confirm fixes or spot recurring instability.
-
Environment and branch context. Results are mapped to environments (dev, stage, prod) so you can quickly access the production impact (see Branch Mapping).
-
Integrated Code Review: A built-in Files Changed view that shows code diffs (additions/deletions) directly alongside the test run results, eliminating the need to switch to GitHub for code review.
-
Filterable PR Timeline: A Timeline view that consolidates commits, test runs, and comments, and lets you filter by event type (e.g., show only Test Runs or Commits).