Overview
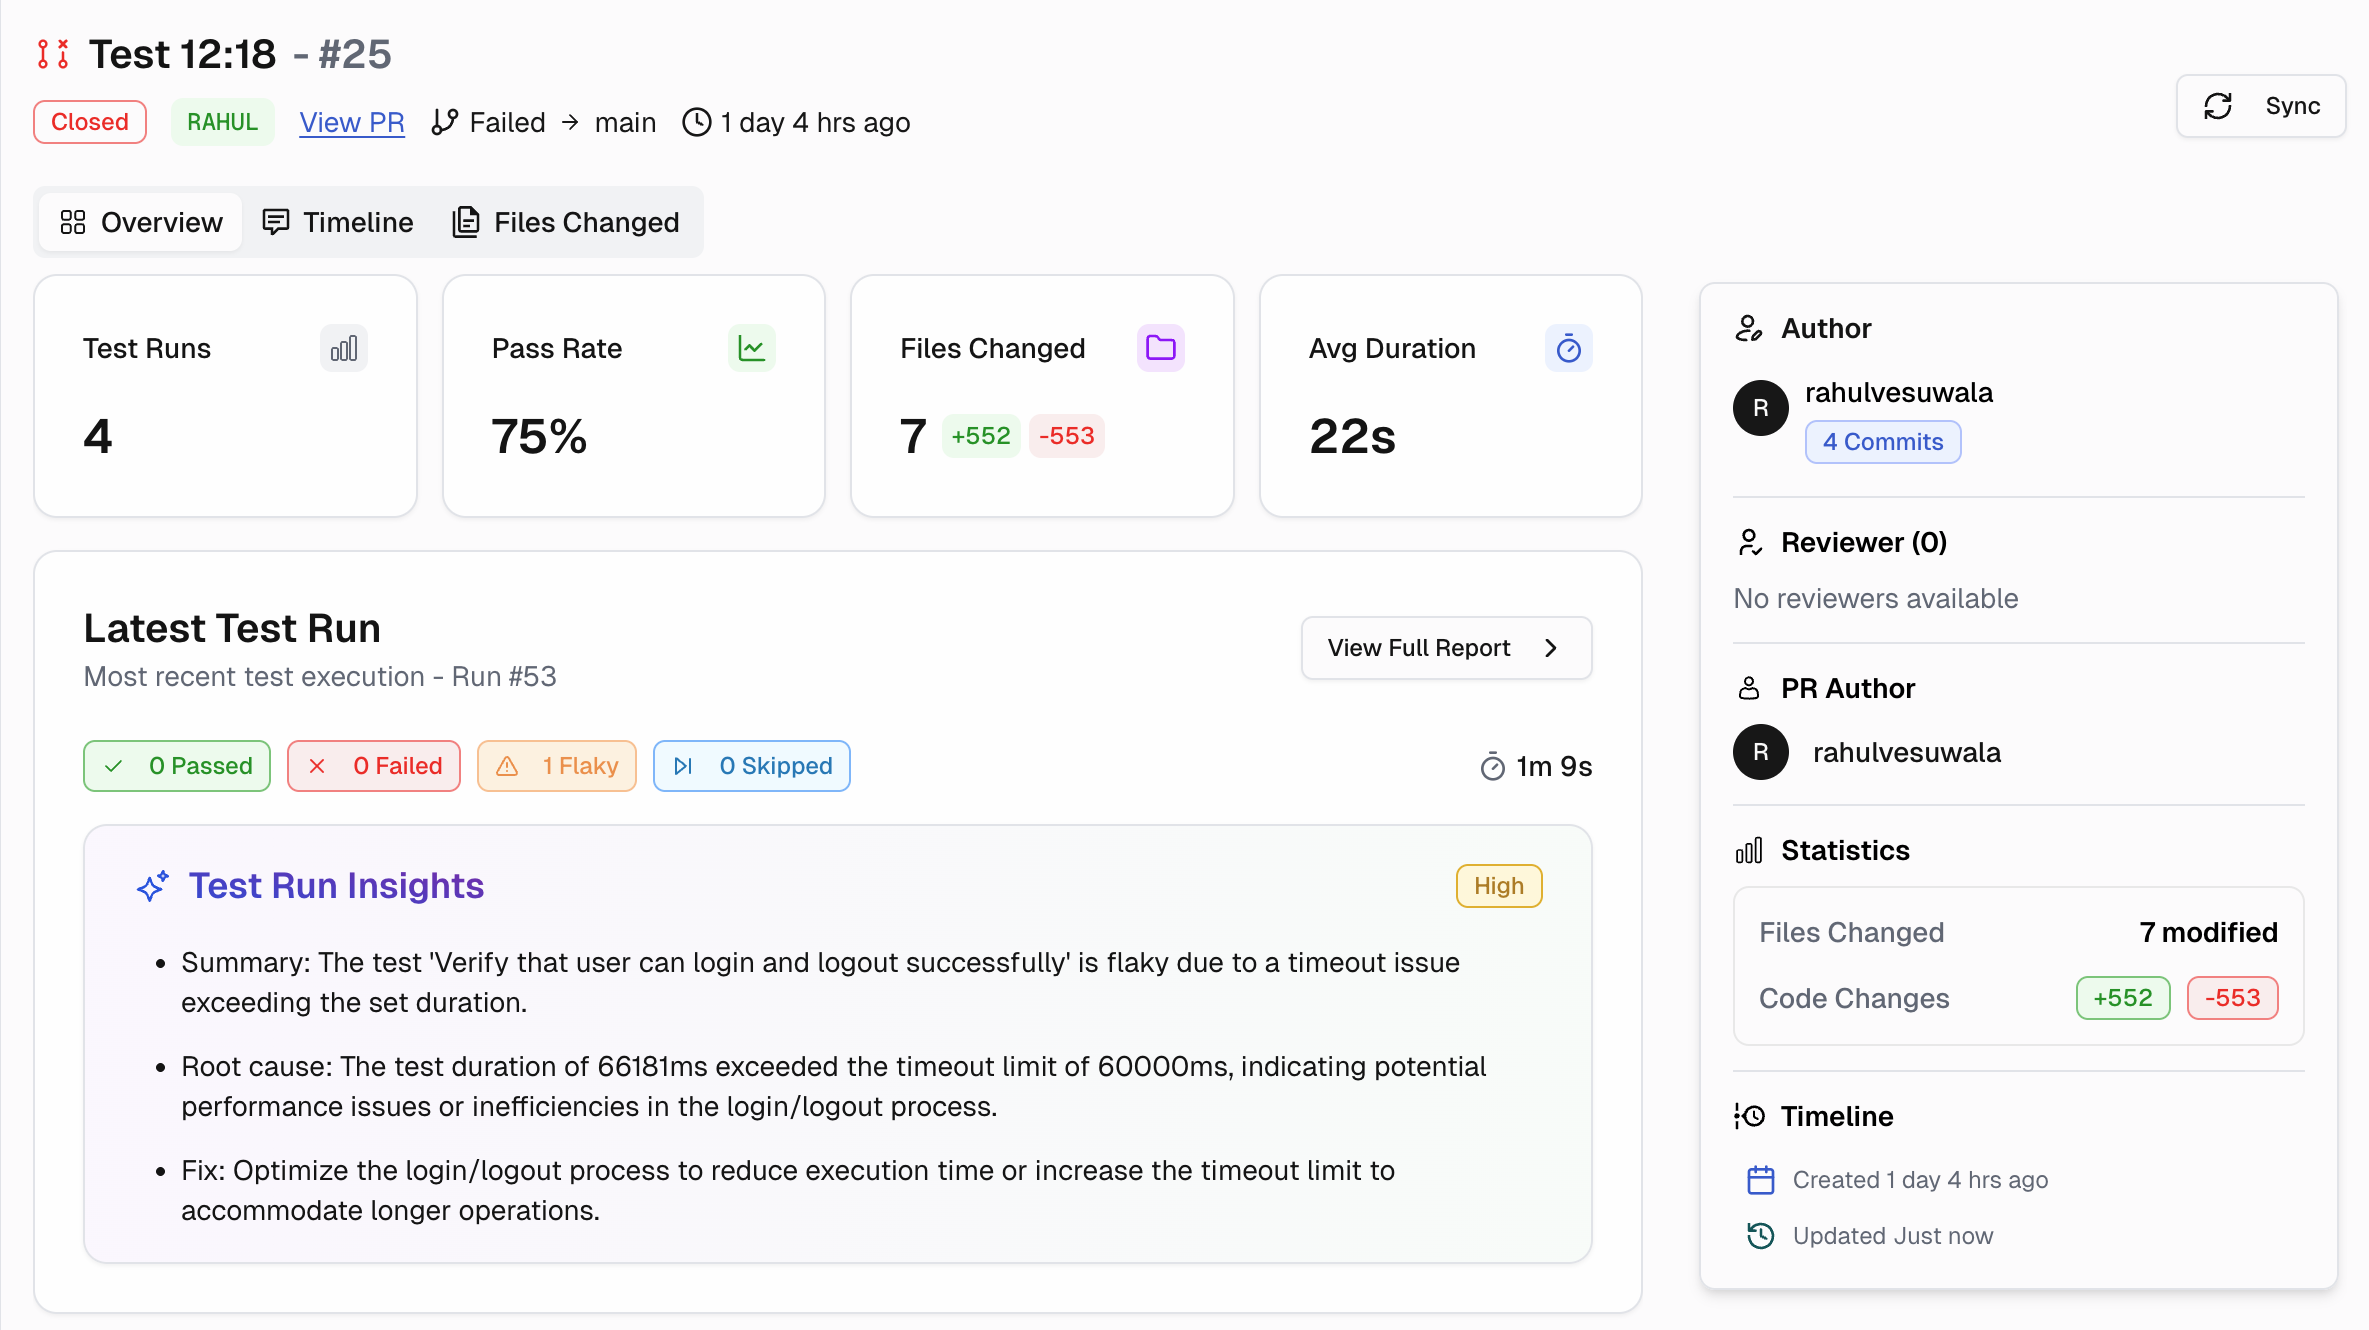
The Overview tab provides an immediate, "at-a-glance" status of the pull request. This view helps reviewers and developers make quick decisions about the PR's health.
PR Header
The PR Header provides the primary context for the pull request at the top of the view. It contains the following key information:
-
PR Title and Number: The name and unique identifier.
-
Status Badge: The current state of the PR.
-
View PR Link: A direct link to the pull request's page in GitHub.
-
Branch Information: The source branch and the target branch.
-
Timestamp: The time of the last update or creation.
Sidebar
A panel displaying PR metadata, statistics, and timeline.
-
Identifies the Author, Reviewer(s), and PR Author.
-
Shows total Files Changed and aggregate Code Changes for the entire pull request.
-
Lists when the PR was created and last updated.
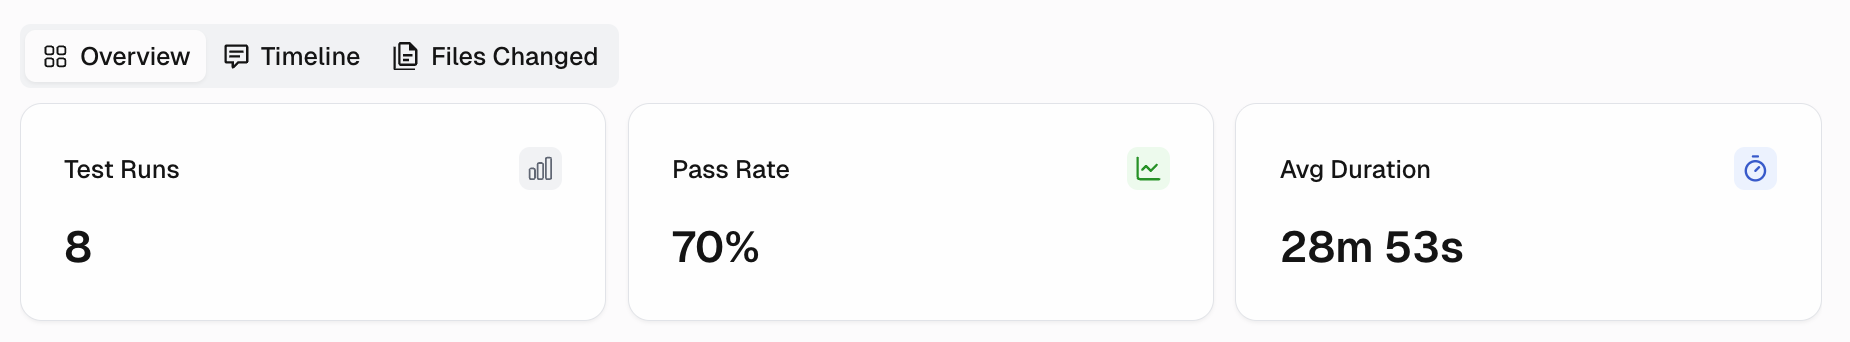
KPI Tiles
1. Test Runs
The total number of test runs executed for this PR.
2. Pass Rate
This is the primary metric for the PR's overall quality, showing the aggregate pass rate across all test runs.
3. Files Changed
This metric defines the size and scope of the PR, summarizing the total number of lines added and deleted.
4. Average Duration
The average execution time for a test run on this PR.
Latest Test Run
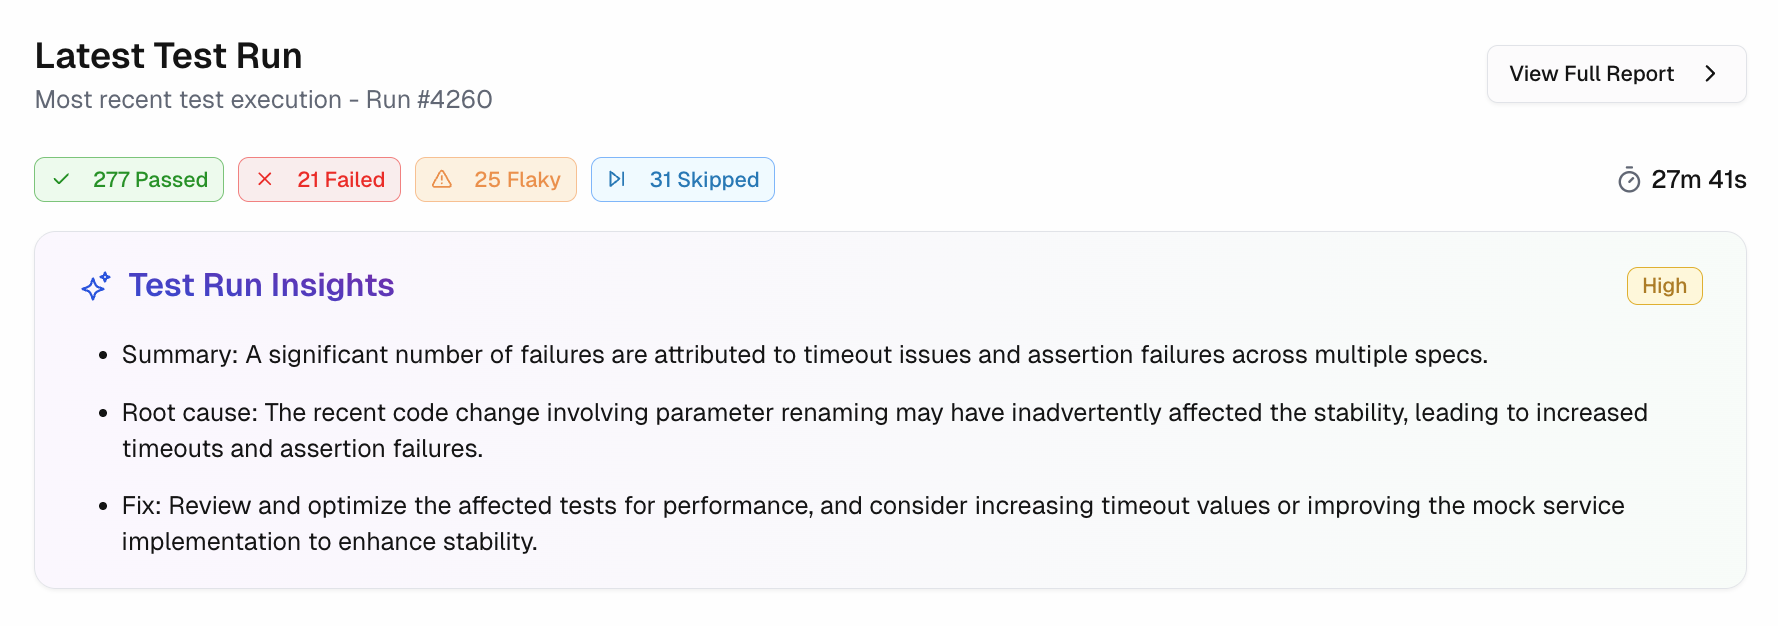
This card focuses only on the most recent test execution, providing immediate feedback on the latest commit.
-
Status Counts: Displays the number of passed, failed, flaky, and skipped tests for this single run.
-
Average Duration: Shows the duration of this specific run.
-
Test Run Insights: Provides an AI-generated summary of the run, including a Root Cause and potential Fix. The run may be labeled with a severity, such as Critical/Medium/Low, based on the number of failures.
Click the View full report button to navigate to the main Test Runs page for that specific execution.
Test Results Trend
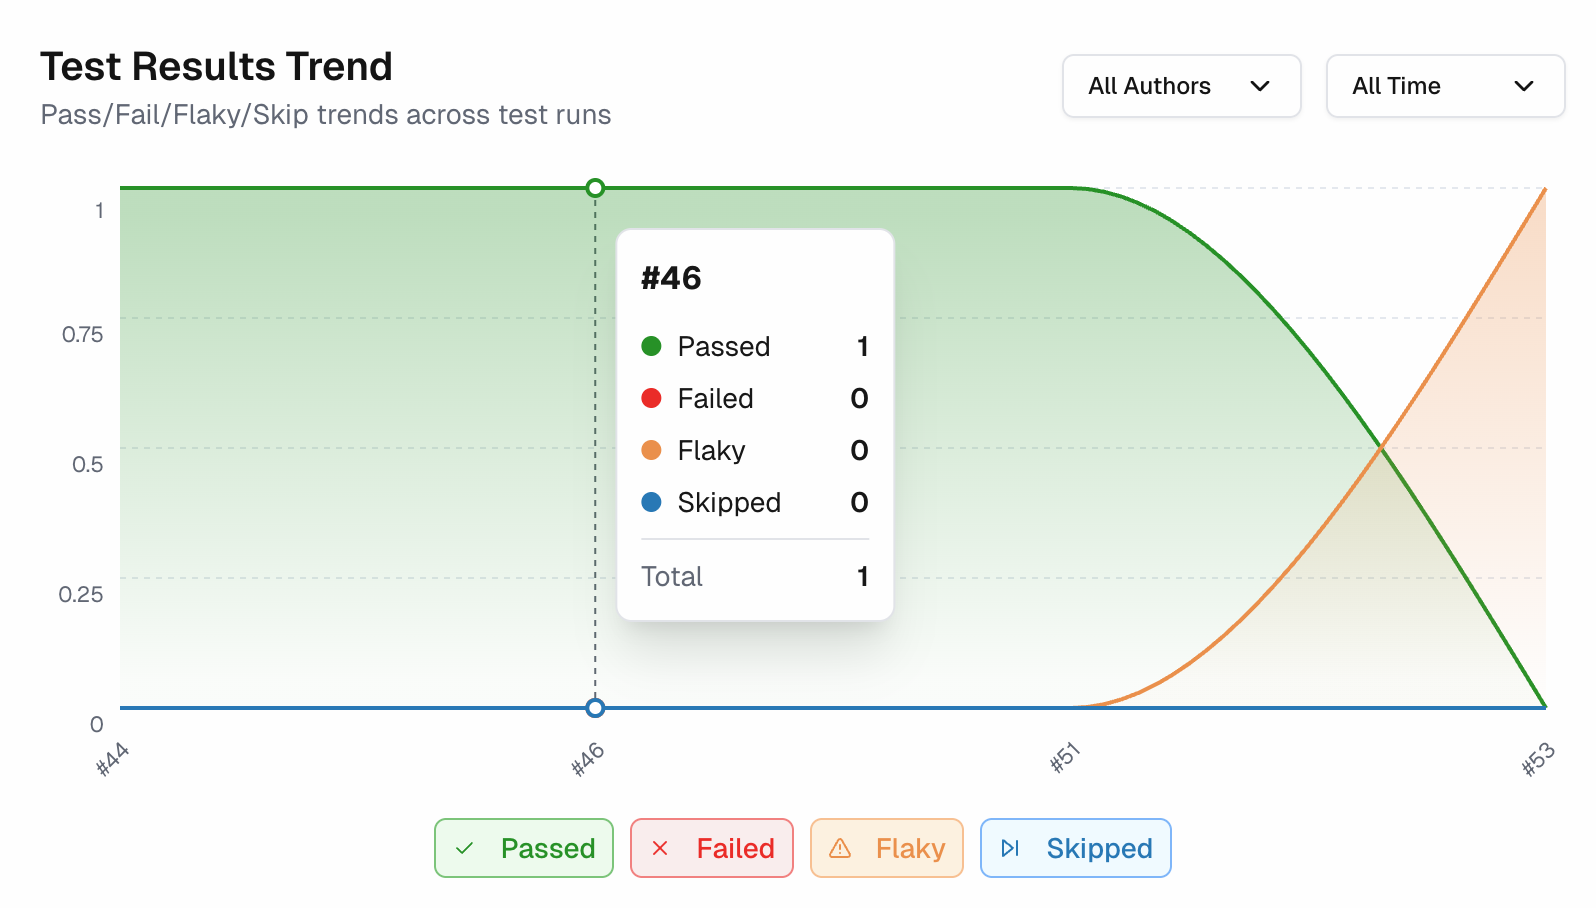
This graph visualizes the history of test runs for the PR, showing trends over time.
-
Trend Graph: Plots the counts of passed, failed, flaky, and skipped tests across all runs.
-
Interactive Tooltip: Hovering over any point on the graph reveals the exact counts for that specific run.
Use the filters on the Test Results Trend card to change the data's scope. You can filter by Author or by a time/run period (e.g., Last 7 runs, Last 14 runs).