Errors
The Errors tab groups all failed and flaky test cases by their error message. Instead of scrolling through a flat list, you see each distinct error once, with every affected test case nested underneath it.
This view answers the question: "Which errors broke this run, and how many tests did each one affect?"
A QA Engineer can quickly spot whether a single error is responsible for most failures or if you're dealing with multiple unrelated problems.
Developers can jump straight to the error message and stack trace without clicking through individual test cases one by one.
Layout
The page has three main sections: a search bar, status filters, and the error groups table.
1. Search
Type a test case name or part of an error message to filter the list. The view updates as you type.
2. Status Filters
Three buttons let you narrow down what you see:
All: Shows every test case in the run, grouped by error
Failed: Shows only test cases that failed outright
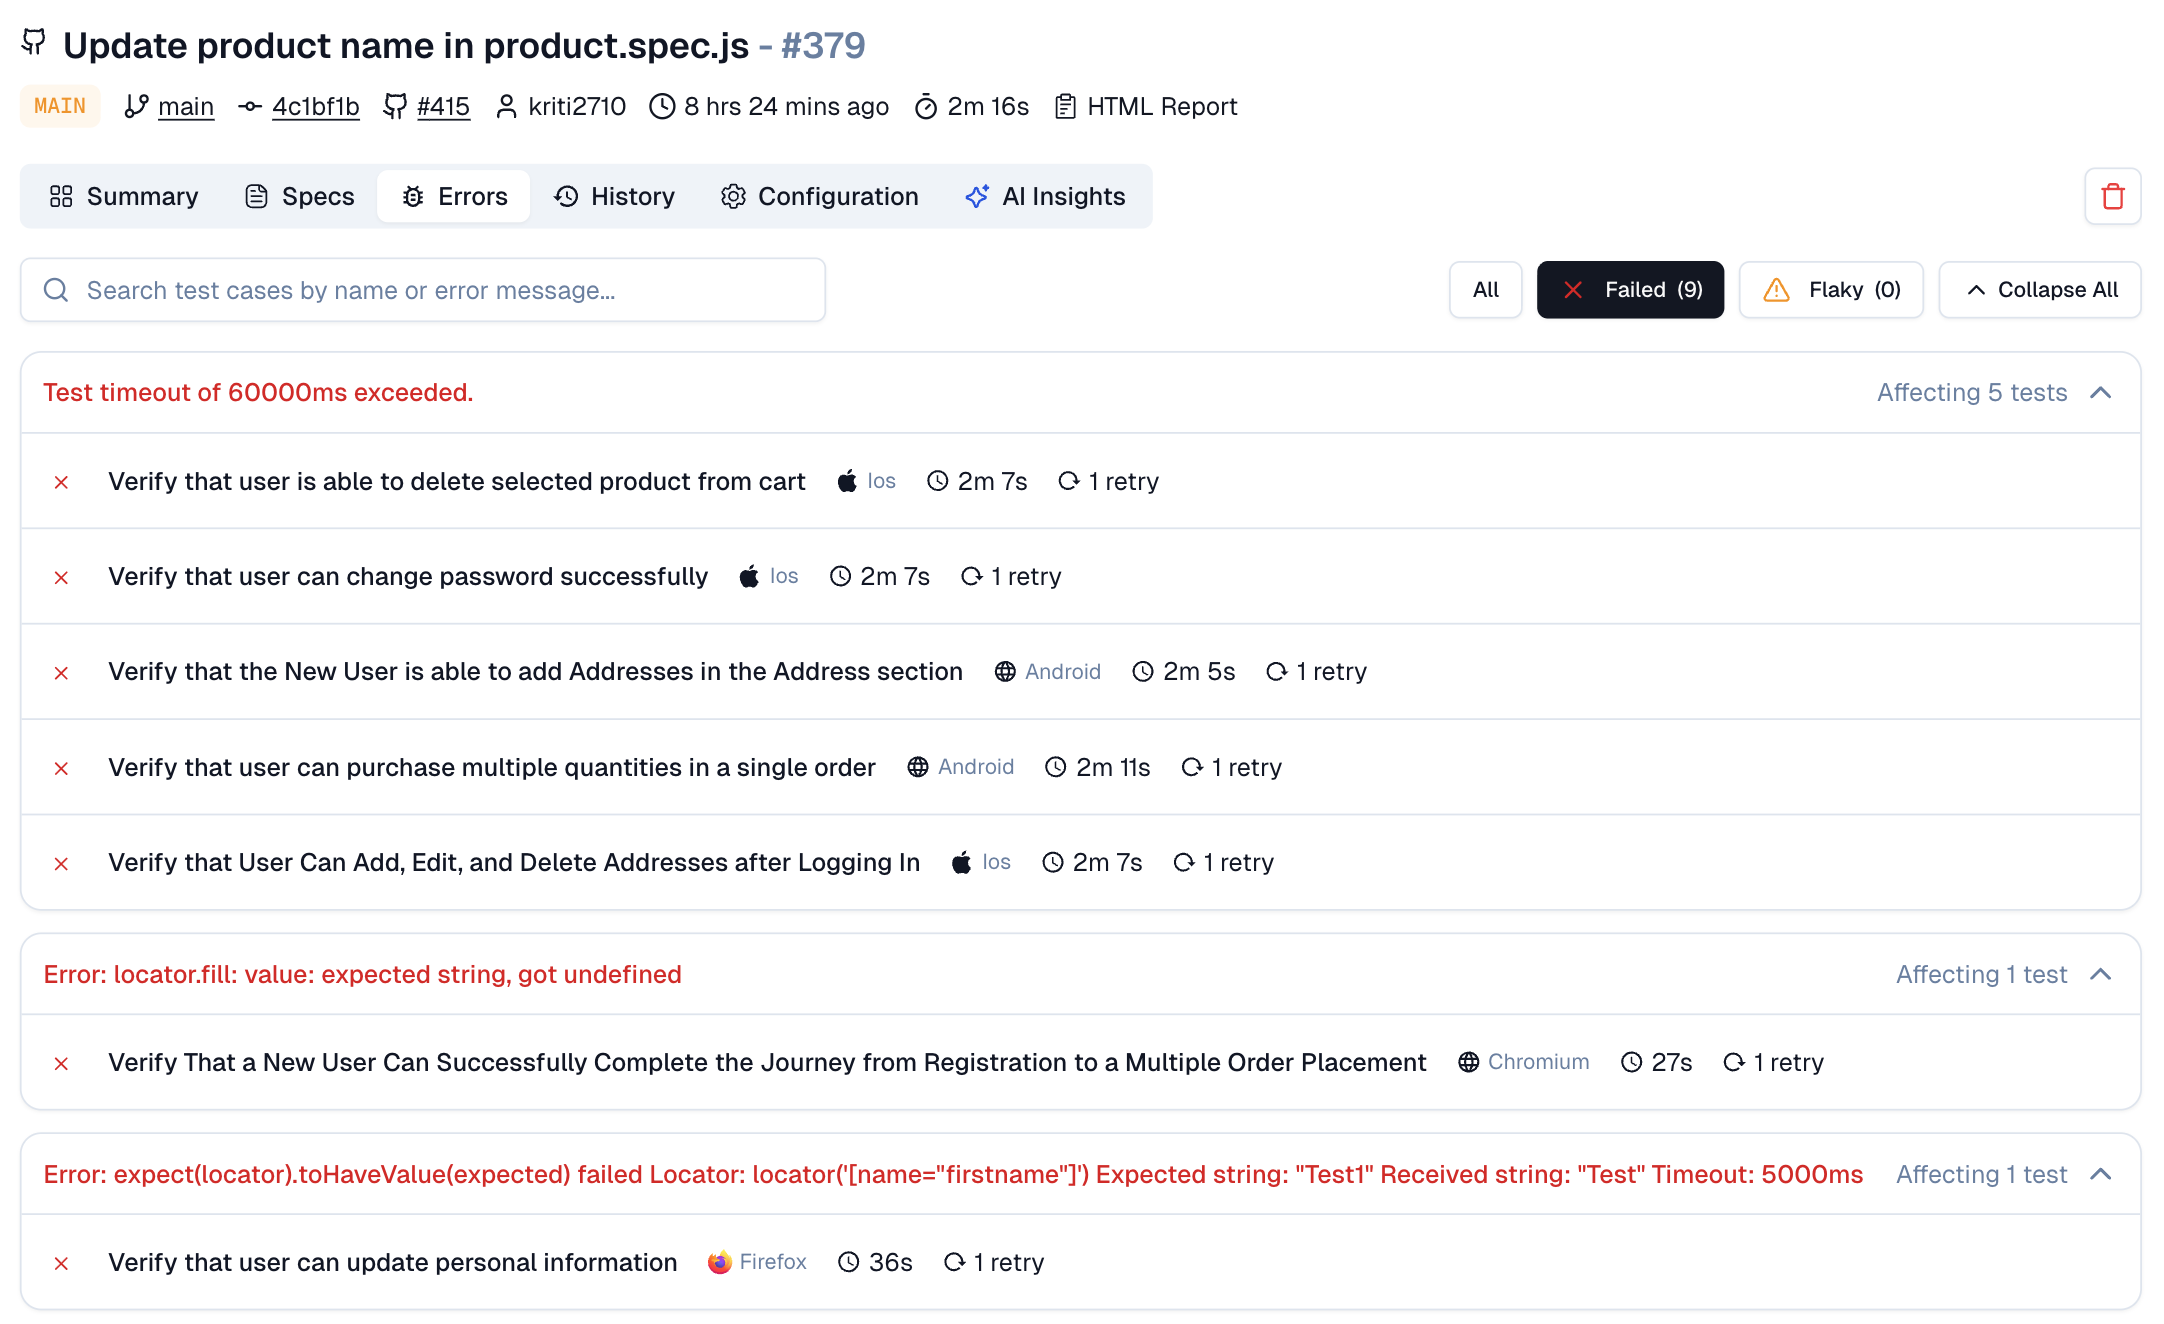
Flaky: Shows only test cases that passed on retry but had at least one failure
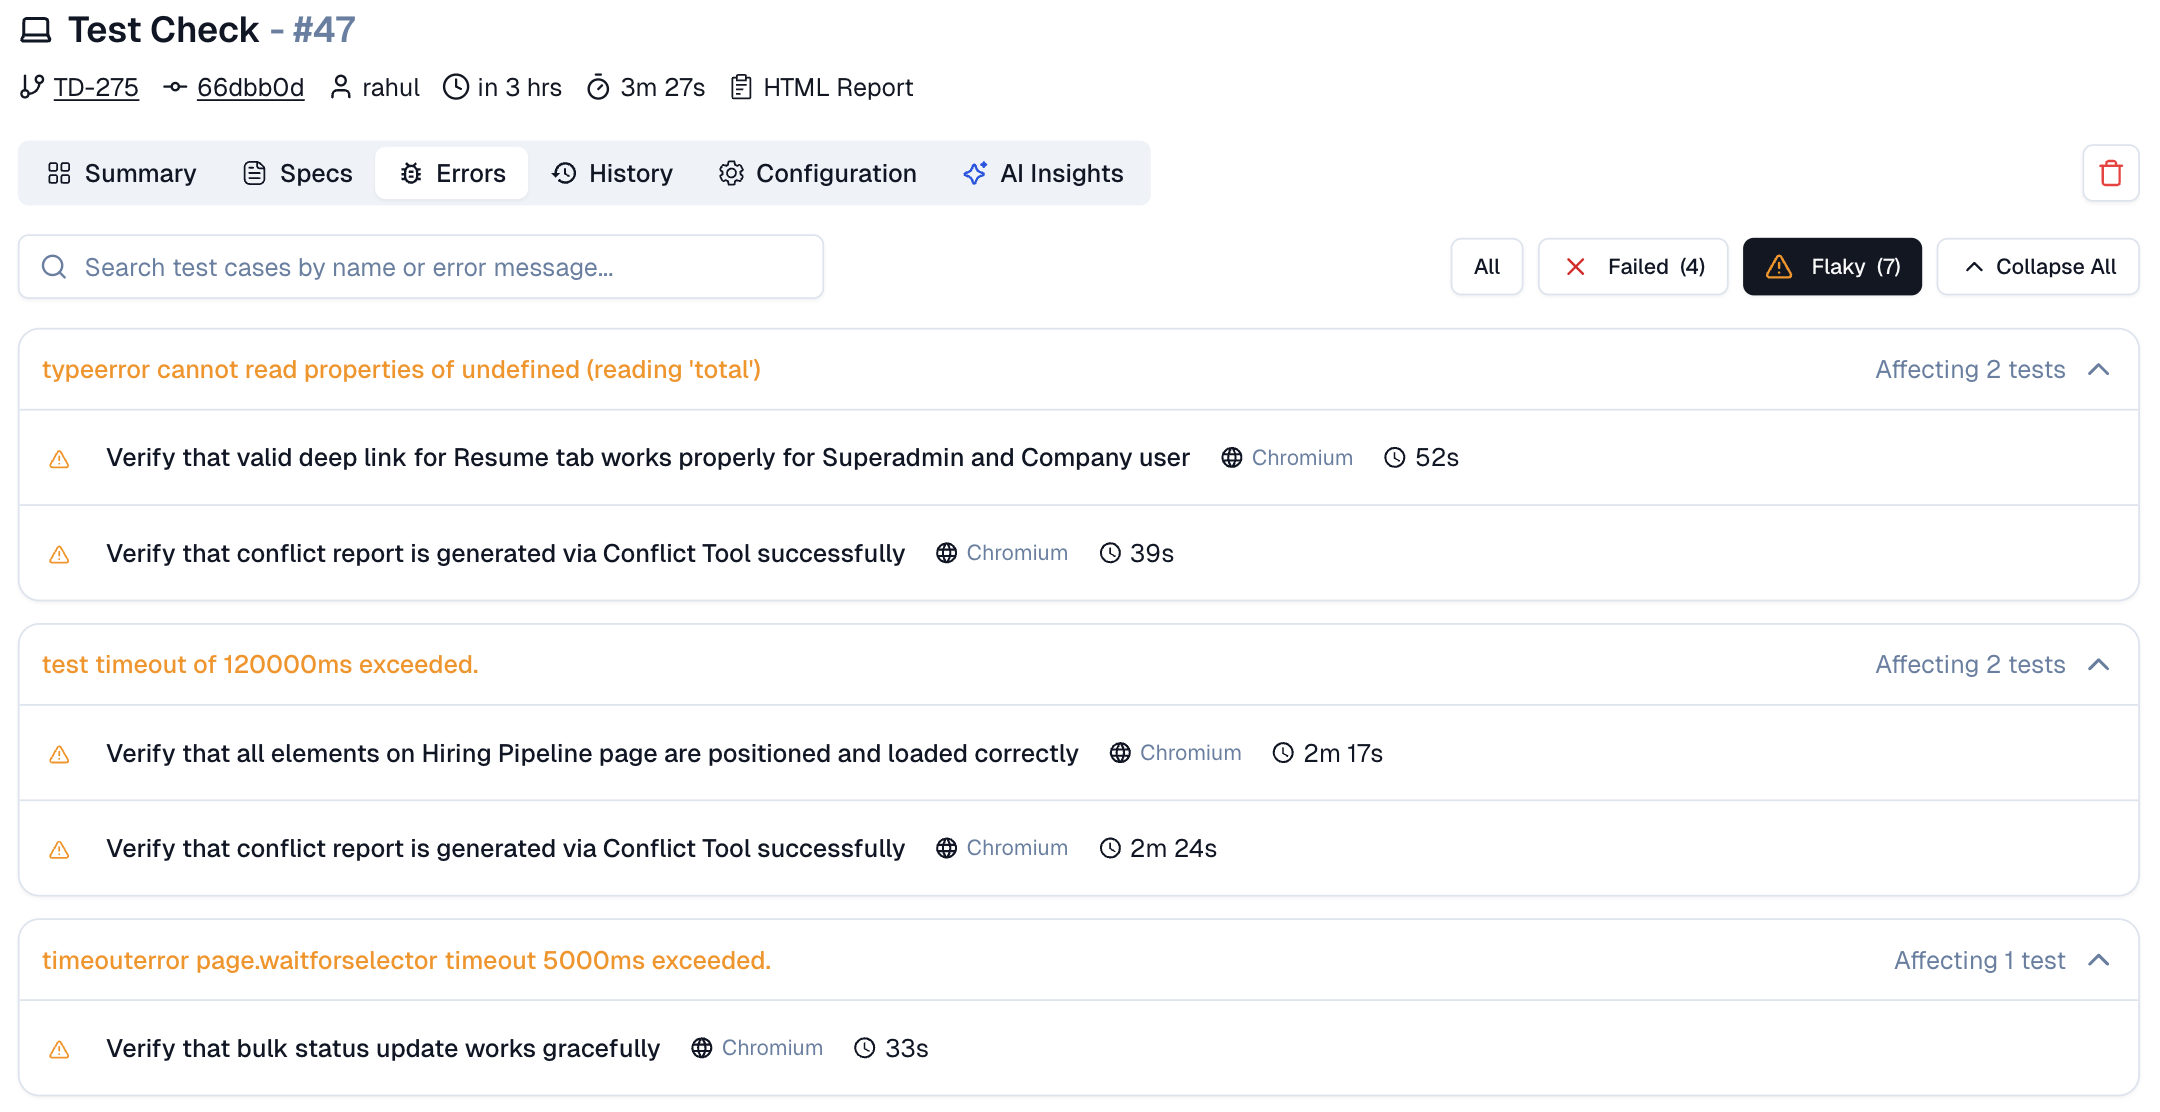
Each filter displays a count in parentheses so you know how many test cases fall into each category.
Expand / Collapse: Use the toggle on the right to expand all error groups at once or collapse them back to just the error headers.
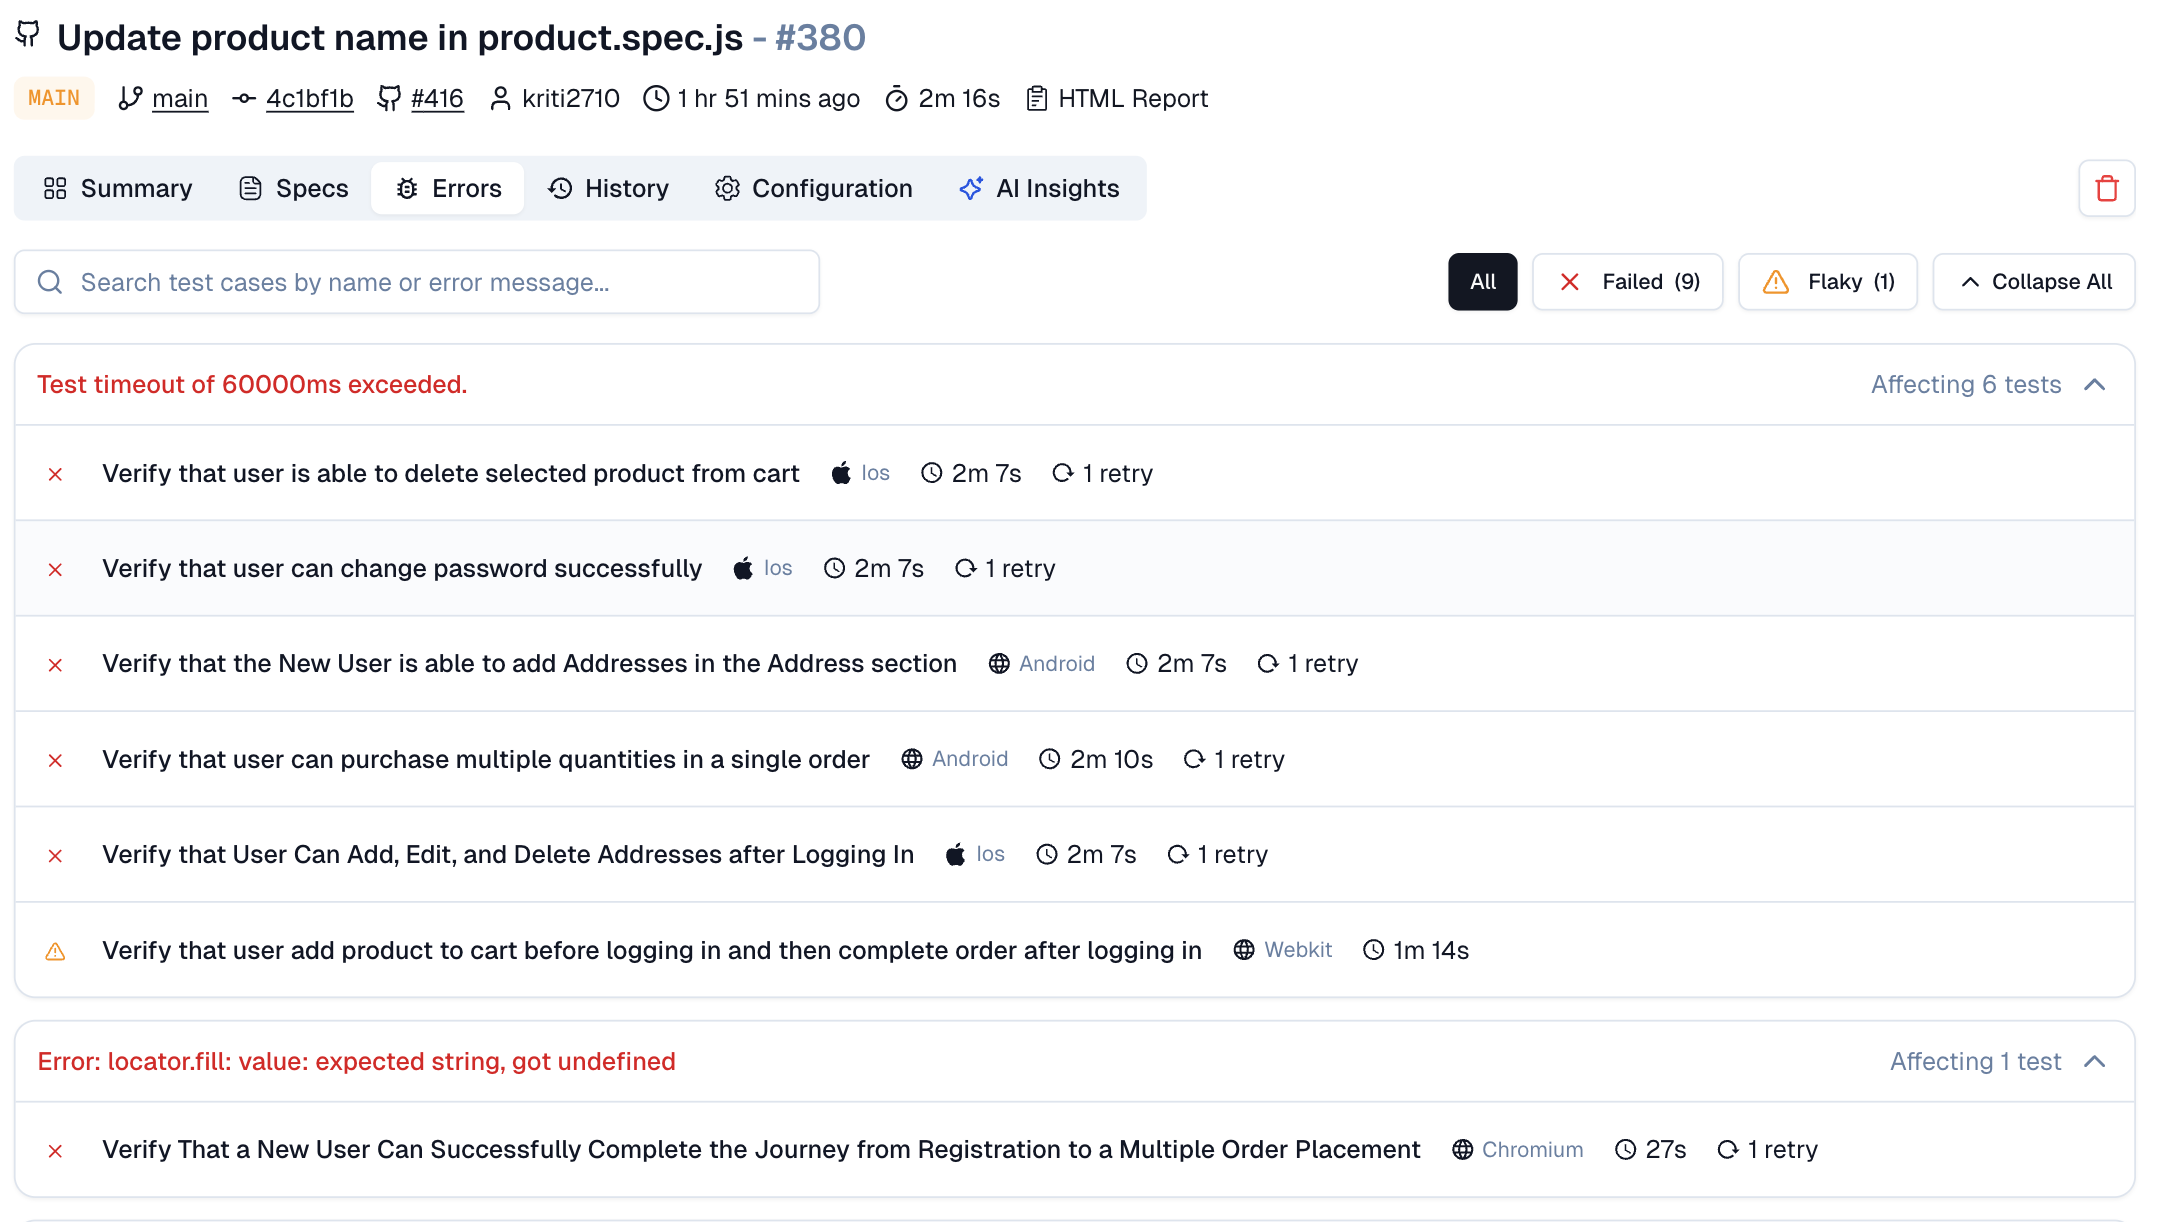
3. Error Groups
Each row in the table represents a unique error message. The error text appears on the left in red, and the number of affected tests appears on the right.
Click the row or the arrow to expand it. Inside, you see every test case that hit this error during the run.
Test Case Rows
Each test case row shows:
-
Status icon: A red X for failed, a yellow warning triangle for flaky.
-
Test name: The full test case title.
-
Browser: Which browser ran the test (Chromium, Firefox, Webkit, iOS, etc.).
-
Duration: How long the test took.
-
Retries: Number of retry attempts, if any.
Click any test case row to open the side panel.
Side Panel
The side panel gives you the full context for a single test case without leaving the page.
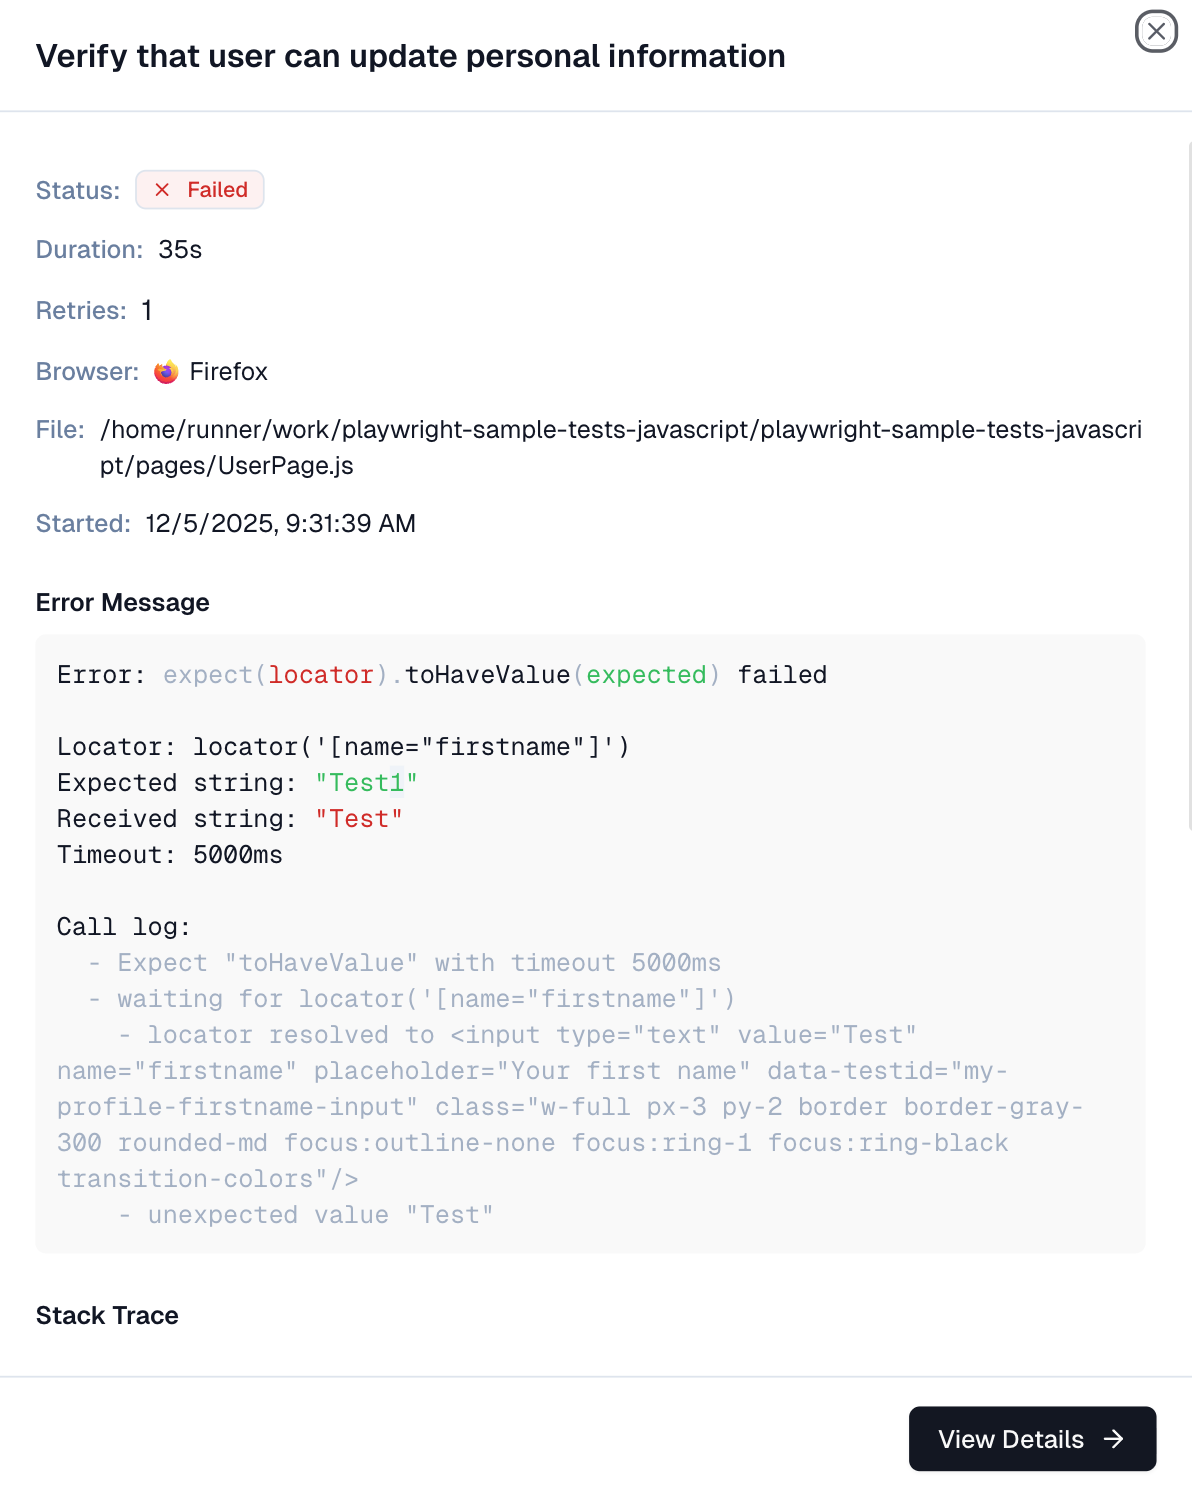
1. Header
The test case name appears at the top, followed by a status badge (Failed or Flaky).
2. Details
| Field | What It Shows |
|---|---|
| Status | Failed or Flaky. |
| Duration | Total time the test took to run. |
| Retries | Number of retry attempts. |
| Browser | The browser or device used. |
| Started | Exact date and time the test began. |
3. Error Message
The actual error returned by Playwright. This is the same text you'd see in your terminal or CI logs.
4. Stack Trace
The call stack at the point of failure. Use this to trace back to the exact line in your test or application code.
5. View Details
A button at the bottom right opens the full Test Case Details page. From there, you can access the Overview, History, and AI Insights tabs for deeper analysis.
What This Solves
Now you don’t have to click into each test case in a test run individually to see its error.
-
You see that timeout once, with all tests listed underneath
-
You know immediately whether you're dealing with one root cause or several. This makes triage faster
-
You can decide which error to fix first based on how many tests it affects, then drill into the stack trace and affected test cases from a single view