Quick Reference
| View | Path | Best for |
|---|---|---|
| QA Dashboard | Dashboard → QA View | Team-wide flaky overview |
| Developer Dashboard | Dashboard → Developer View | Author-specific flaky tests |
| Analytics | Analytics → Summary | Flakiness trends |
| Test Run | Test Runs → Summary | Per-run flaky breakdown |
| Test Case | Test Case → History | Single test stability |
| Specs | Specs | Flaky rate by file |
QA Dashboard
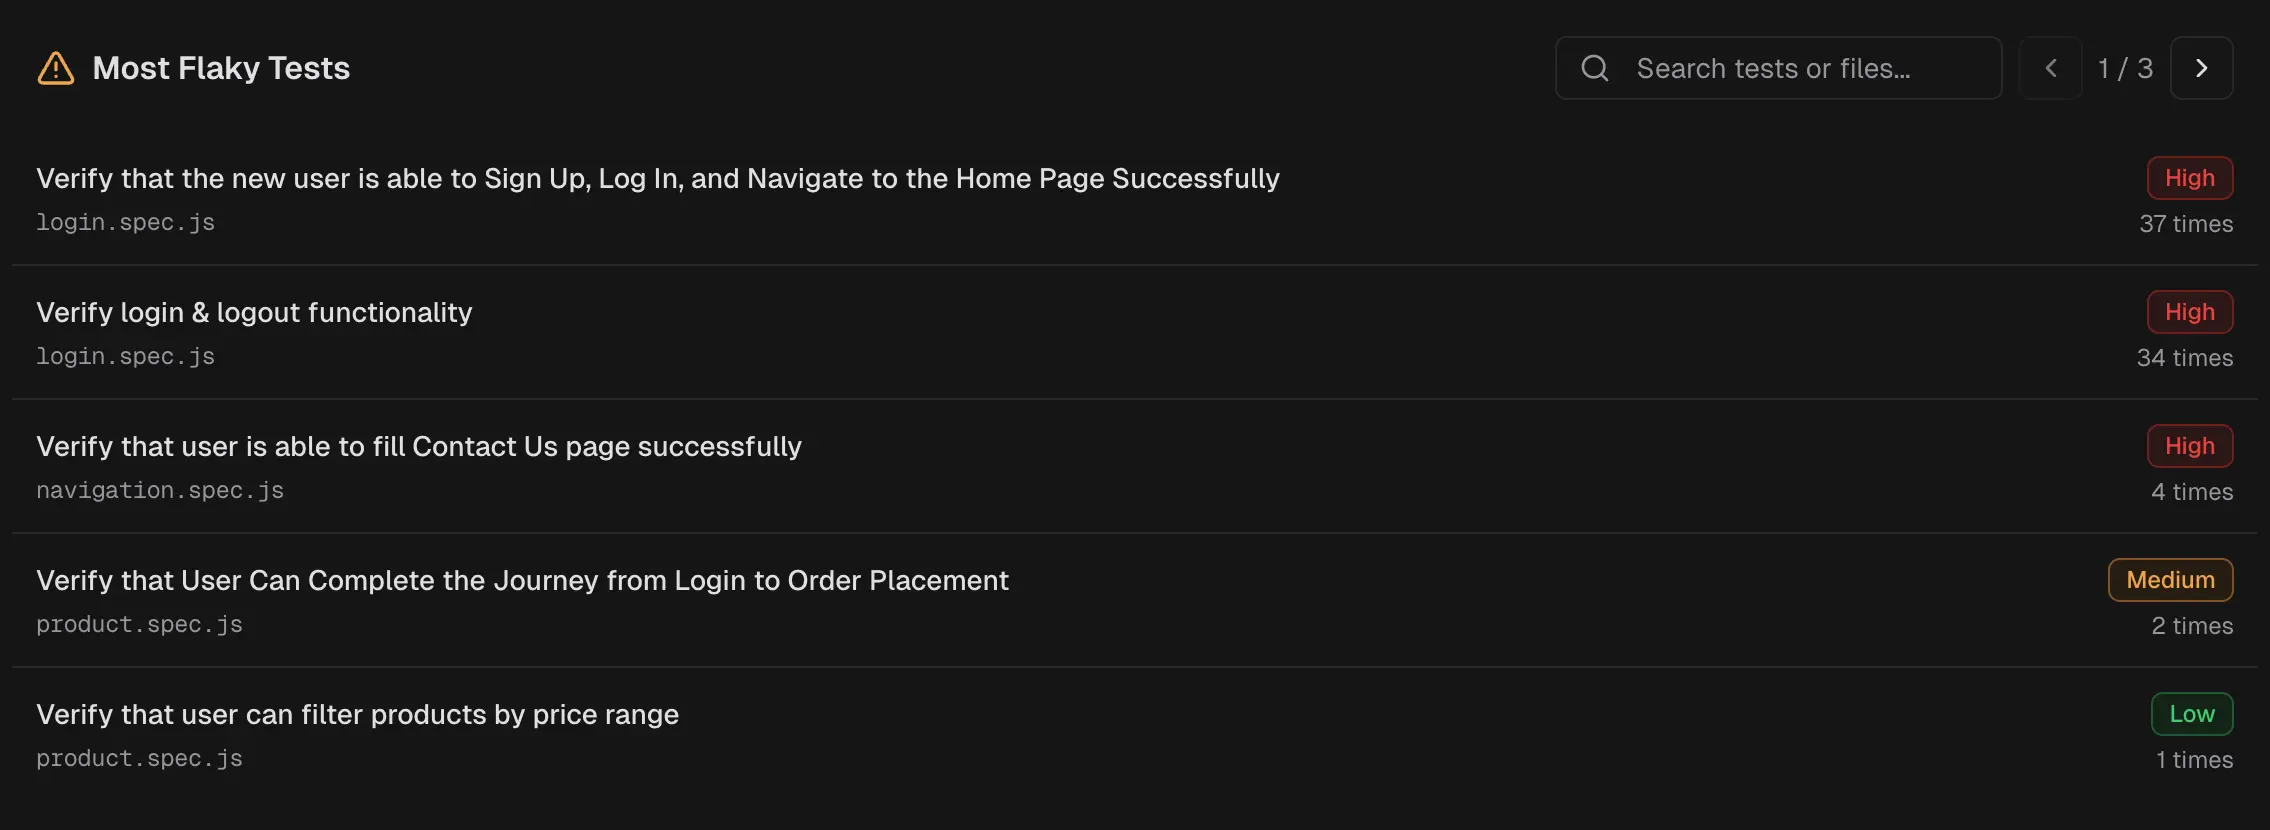
Open Dashboard → QA View. The Most Flaky Tests panel lists tests with the highest flaky rates in the selected period and environment. Each entry shows:- Test name and spec file
- Flaky rate percentage
- Link to the latest run
Developer Dashboard
Open Dashboard → Developer View. The Flaky Tests Alert panel shows flaky tests filtered by author. Developers see which of their tests are unstable.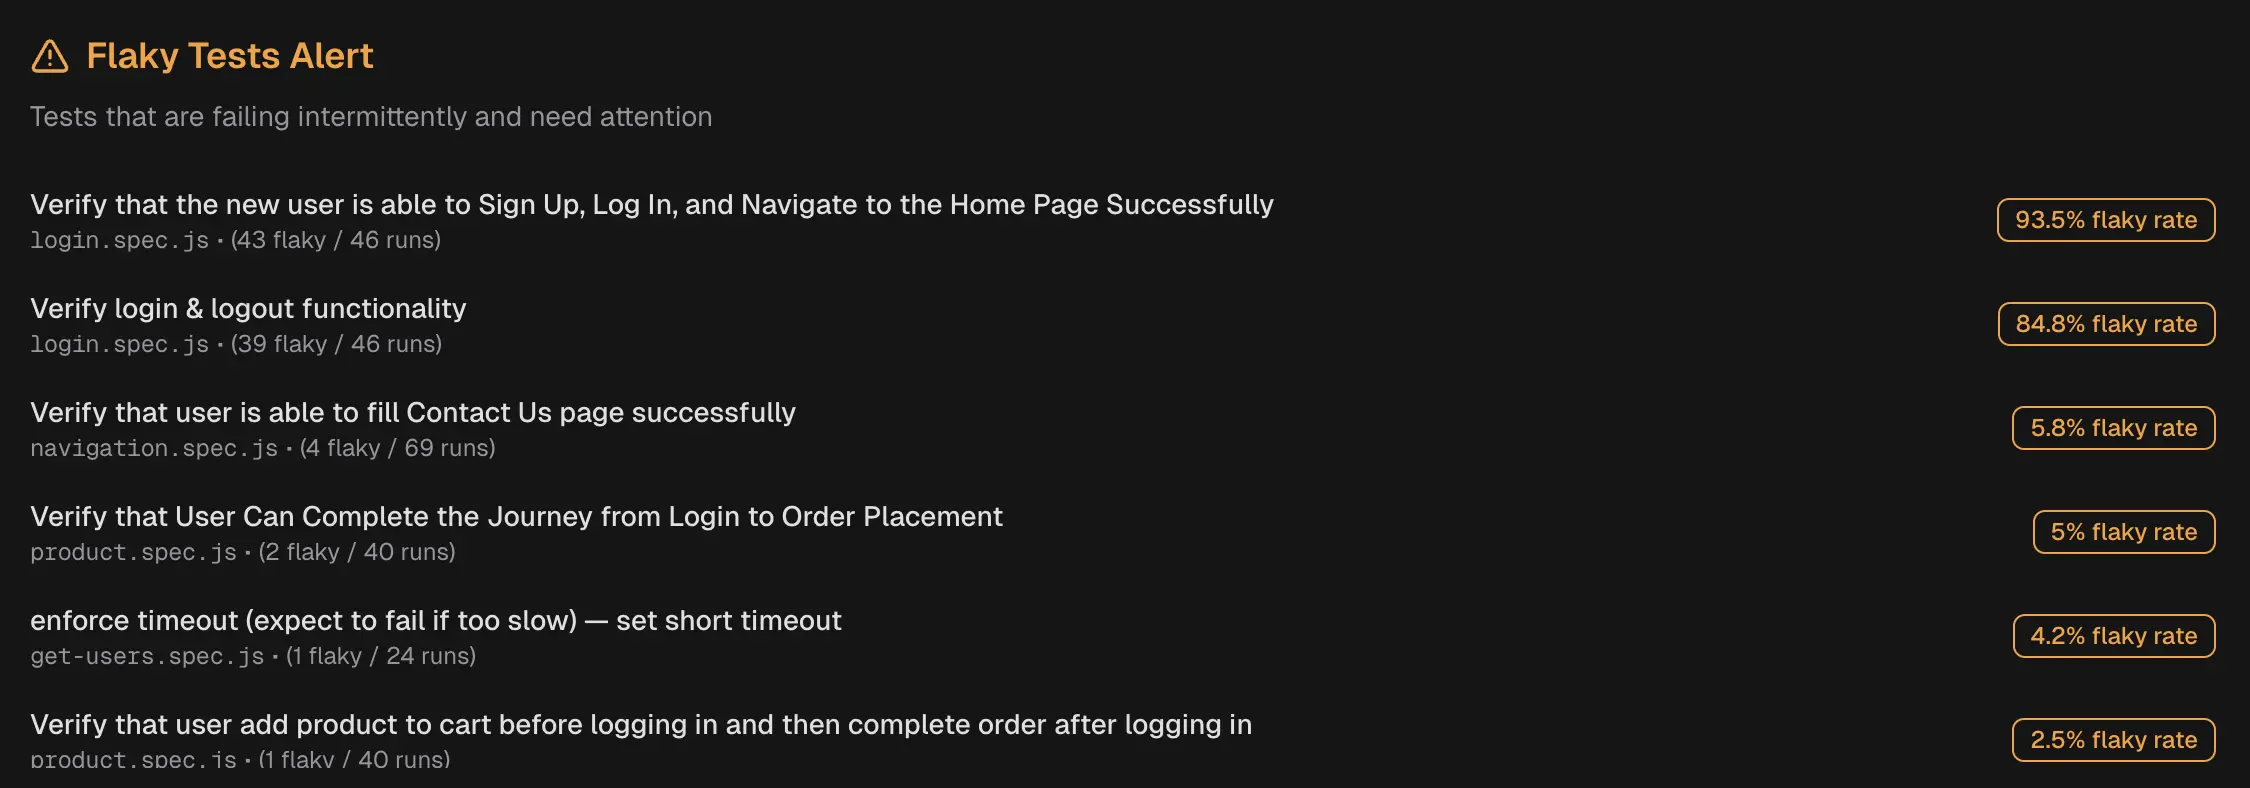
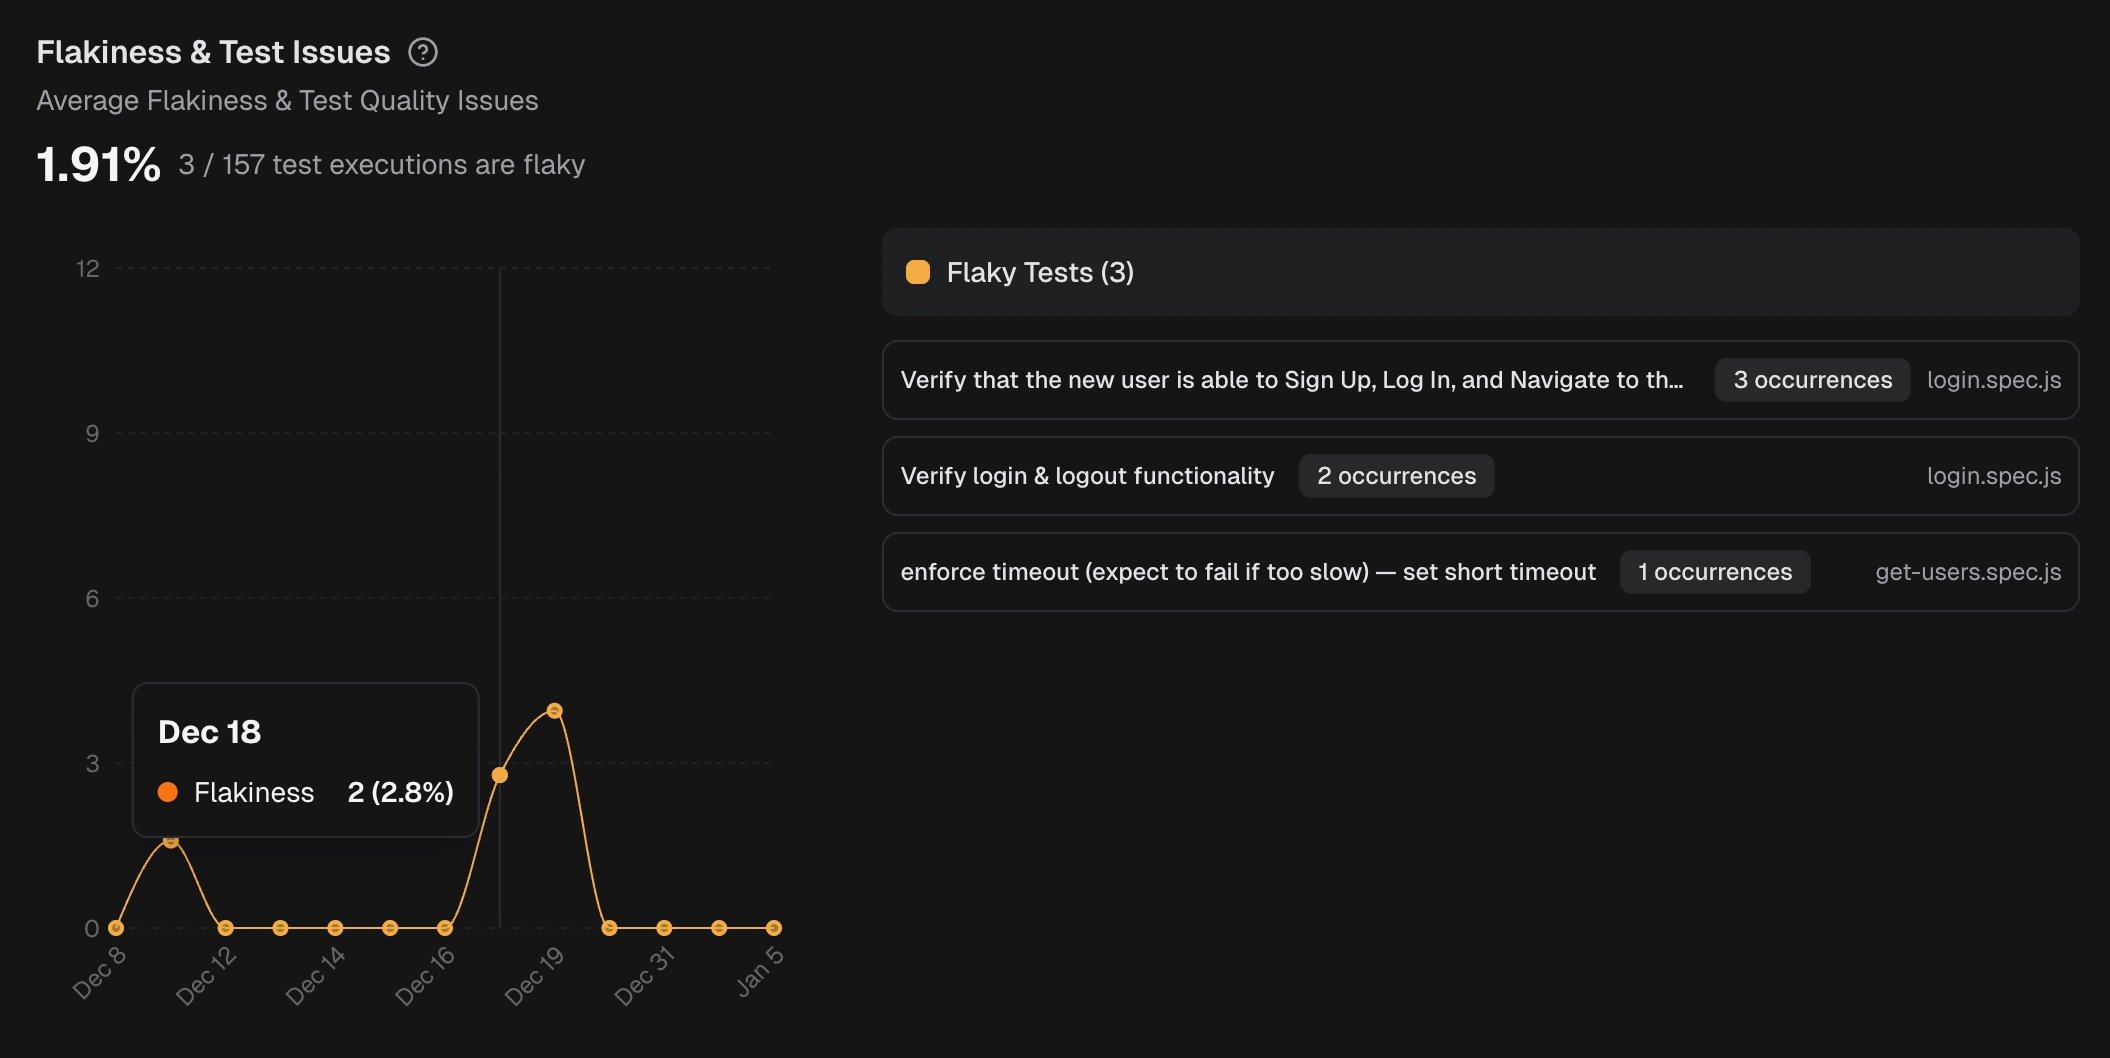
Analytics Summary
Open Analytics → Summary. The Flakiness & Test Issues chart shows:- Flaky rate trend over time
- List of flaky tests with spec file and execution date
Test Run Summary
Open any test run. The Summary tab shows flaky test counts grouped by sub-category:- Timing Related
- Environment Dependent
- Network Dependent
- Assertion Intermittent
- Other Flaky
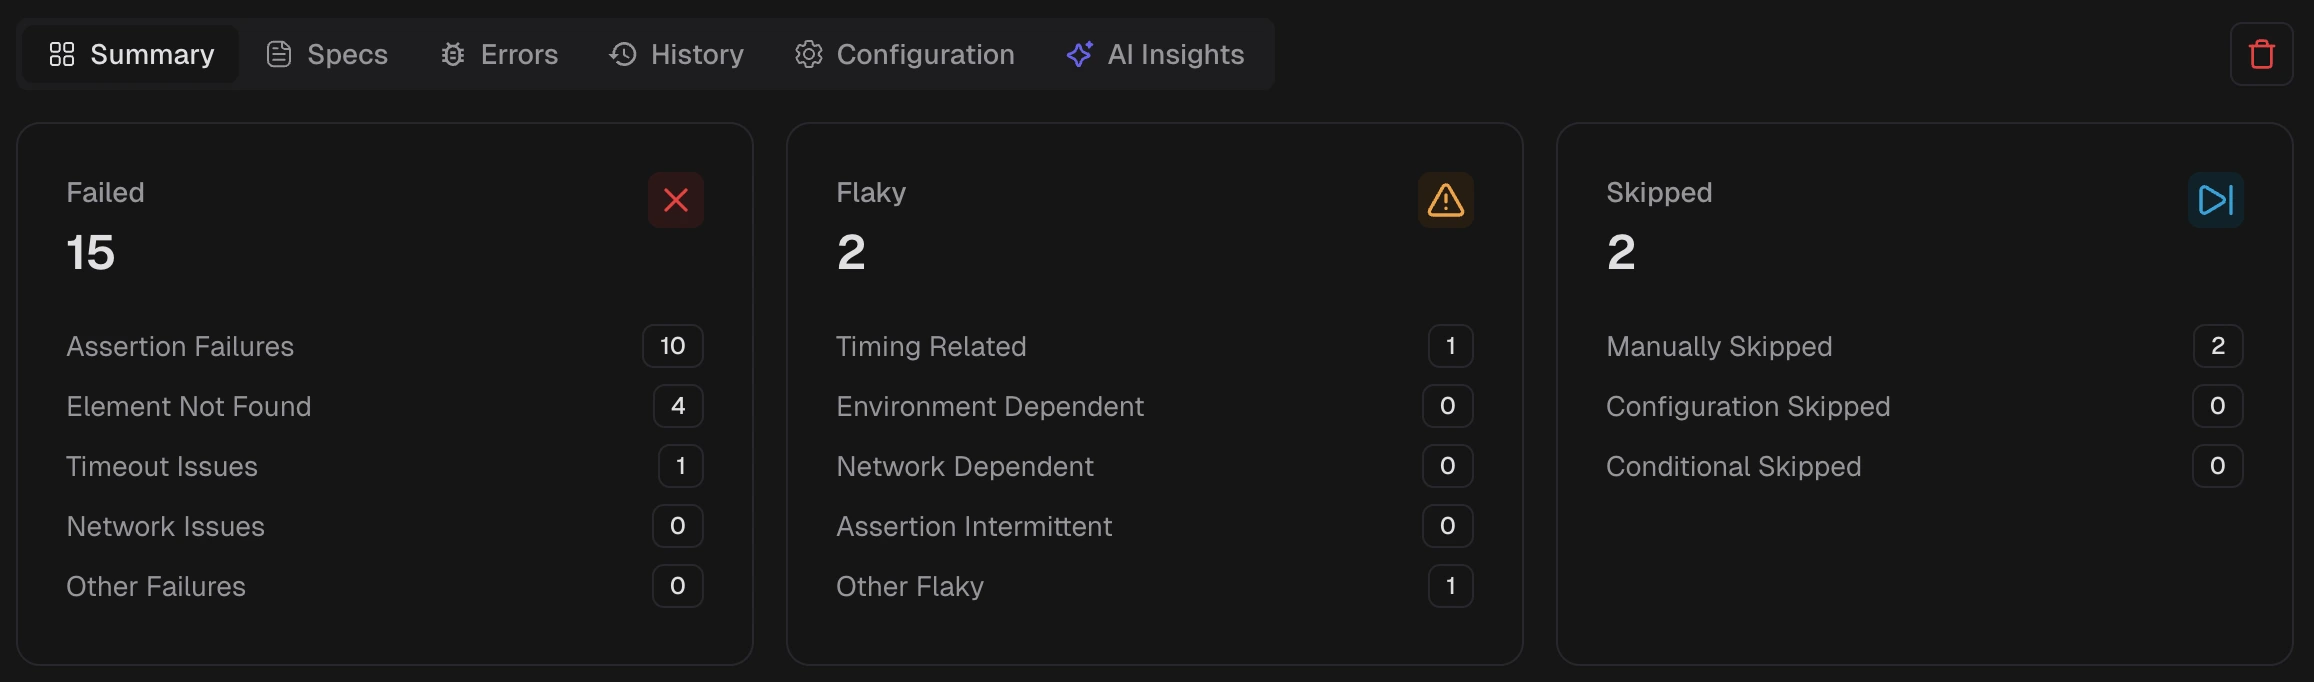 Click a category to filter the detailed analysis table.
Test Case History
Open a specific test case and go to the History tab. The stability percentage shows how often the test passes: Stability = (Passed Runs ÷ Total Runs) × 100 A test with 100% stability has never failed or been flaky. Any value below 100% indicates inconsistent behavior. The Last Flaky tile links to the most recent run where the test was marked flaky.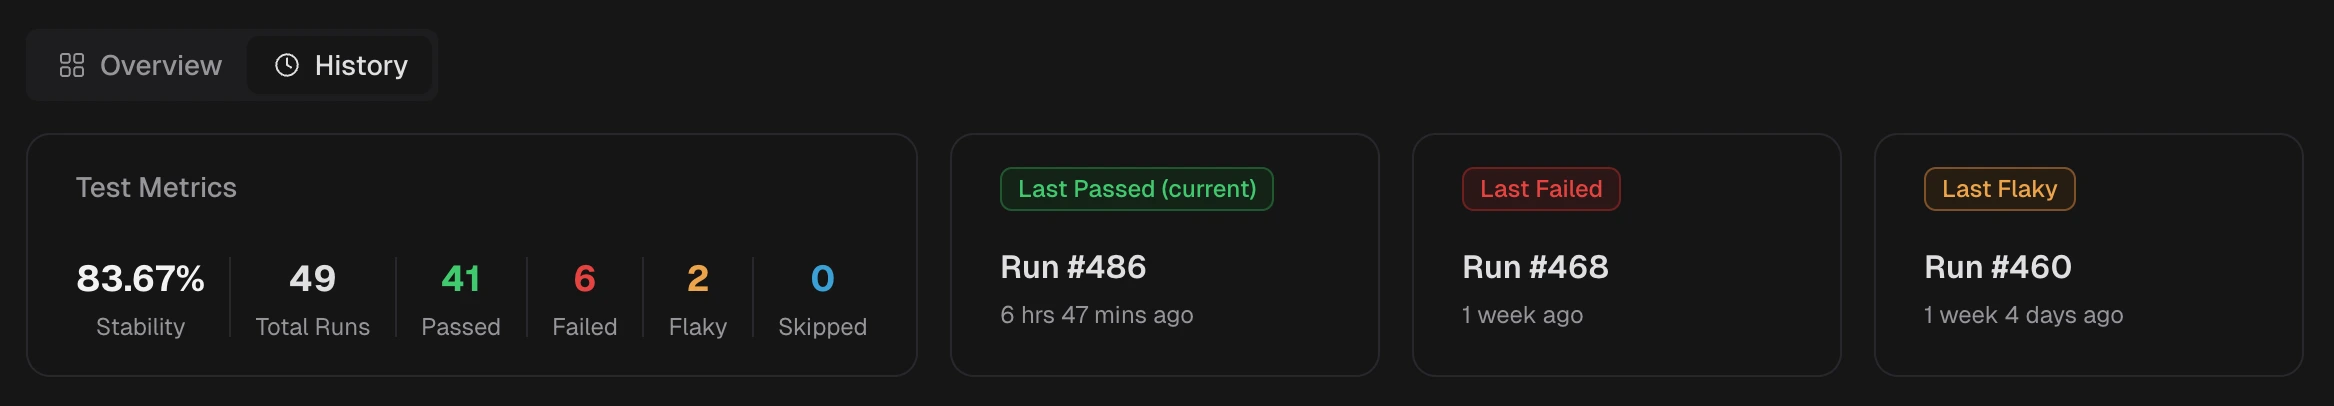
Specs Explorer
Open Specs from the sidebar. The Flaky Rate column shows the percentage of executions with flaky results for each spec file. Sort by flaky rate to find the most unstable spec files.Cross-Environment Comparison
Open Dashboard → QA View → Cross-Environment Performance. The Flaky Rate row shows flaky percentages per environment.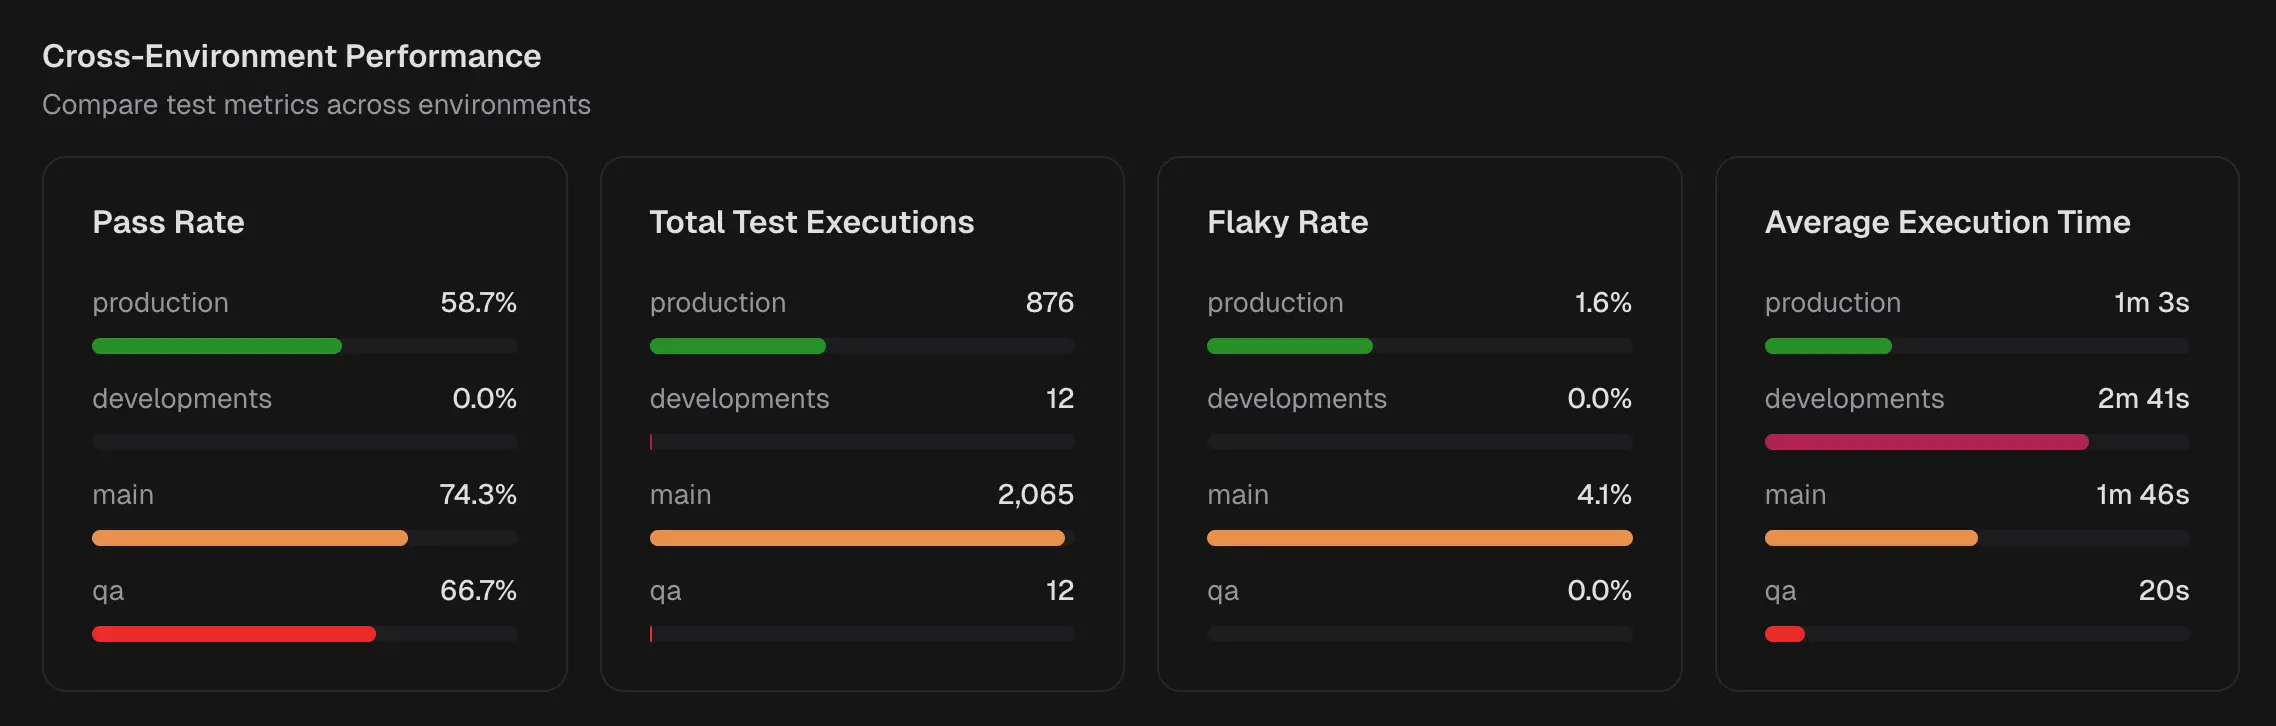
High flaky rates in specific environments suggest environment-dependent issues like resource constraints or service availability.