Getting Started
What is TestDino and how does it work?
What is TestDino and how does it work?
- Configure Playwright to emit JSON and HTML reports
- Upload reports using the CLI (
tdpwortestdino) or through CI - TestDino processes results and links runs to branches/PRs
- View results in dashboards, track trends in Analytics, and create tickets from failures
What problems does TestDino solve for QA teams?
What problems does TestDino solve for QA teams?
- Manual triage - Error grouping clusters failures by root cause
- Scattered evidence - Aggregates screenshots, videos, traces, and logs in one place
- No historical context - Tracks trends and flakiness across runs
- Slow handoffs - Pre-fills Jira/Linear/Asana tickets with full context
- Unclear readiness - GitHub CI Checks give clear pass/fail signals
How do I get started with TestDino?
How do I get started with TestDino?
- Create an organization and a project
- Generate an API key from your project settings
- Configure your Playwright reporter to output JSON format
- Upload your first test run using the TestDino CLI
What files do I need to upload to TestDino?
What files do I need to upload to TestDino?
report.json- Contains test results, metadata, and structure
- HTML report - Enables screenshots, videos, and trace viewing
- Traces - For interactive step-by-step debugging
- Videos - For visual test playback
- Screenshots - For failure evidence
playwright.config.js, then upload the report folder using the CLI.Do I need to change my existing Playwright tests?
Do I need to change my existing Playwright tests?
- Add JSON and HTML reporters to your
playwright.config.js - Upload reports using the TestDino CLI after tests run
Setup and Configuration
How does TestDino differ from Playwright's built-in HTML and JSON reporters?
How does TestDino differ from Playwright's built-in HTML and JSON reporters?
- Cross-run analytics: Trends and failure patterns over time
- Error grouping: Cluster failures by error message and root cause
- Git and PR awareness: Links test runs to commits, branches, and PRs
- Integrations: Jira, Linear, Asana, Slack, GitHub
- Historical tracking: Stability scores and regression detection
Which programming languages does TestDino support?
Which programming languages does TestDino support?
- JavaScript / TypeScript - Use the
tdpwCLI (npm package) - Python - Use the
testdinoCLI (PyPI package) withpytest-playwright
How do I upload Playwright reports using the JavaScript or Python CLI?
How do I upload Playwright reports using the JavaScript or Python CLI?
--upload-html, --upload-images, --upload-videos, --upload-traces, --upload-full-jsonDoes TestDino work with monorepos?
Does TestDino work with monorepos?
Can I use TestDino if my tests are in a separate repository?
Can I use TestDino if my tests are in a separate repository?
Do I need MCP to use TestDino?
Do I need MCP to use TestDino?
- Web dashboard - View test runs and analytics
- CLI - Upload reports, cache results, rerun failed tests
- Integrations - GitHub, Slack, Jira, Linear, Asana
API Keys and Authentication
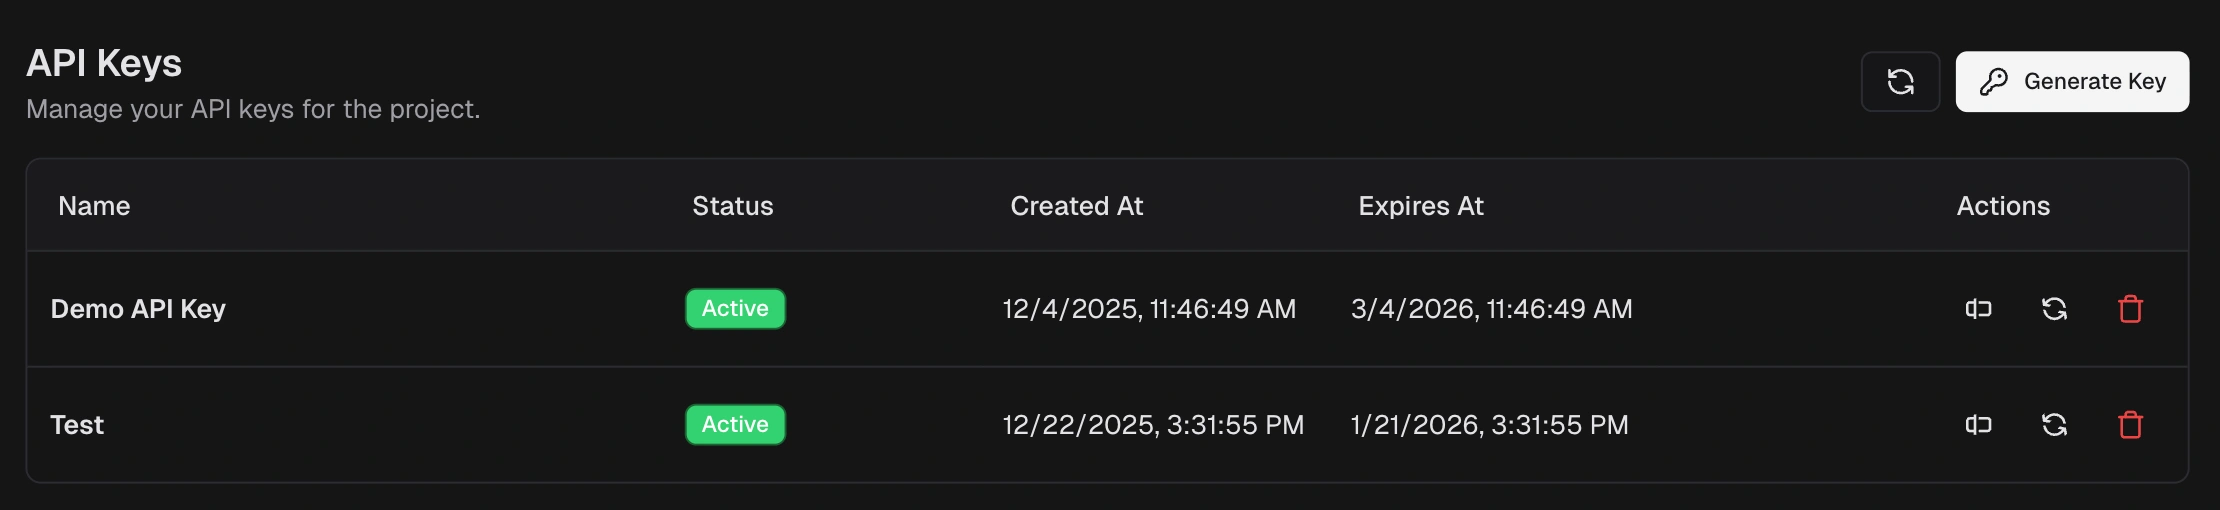
How do I generate and manage API keys?
How do I generate and manage API keys?
- Go to Project Settings. API Keys
- Click Generate Key
- Name the key and set an expiration (if available)
- Copy the secret immediately and store it in your secret manager
- Use it in CI as an environment variable, then reference it in the upload command
My API key expired. How do I rotate it?
My API key expired. How do I rotate it?
- Generate a new key in Project Settings. API Keys
- Update CI secrets with the new key
- Run one upload to confirm it works
- Revoke or delete the old key
How do I troubleshoot API request failures or run ID not found errors?
How do I troubleshoot API request failures or run ID not found errors?
- Verify
TESTDINO_API_KEYis set correctly - Check internet connectivity
- Look for HTTP status codes in error messages
- Use
list_testrunsto confirm the run exists - Verify you’re querying the correct project
- Check if the run ID format is correct (or use the counter instead)
Test Runs and Uploads
How do I upload test results from CI?
How do I upload test results from CI?
Why are my uploaded runs not appearing?
Why are my uploaded runs not appearing?
- API key: Verify the token is correct and not expired
- Report path: Ensure the folder contains
report.json - Project match: API key must belong to the target project
- Upload success: Check CLI output for errors
- Sync: Click the Sync button in the Test Runs view
--verbose for detailed upload logs.What is the difference between a test run, a test case, and a spec file?
What is the difference between a test run, a test case, and a spec file?
playwright test command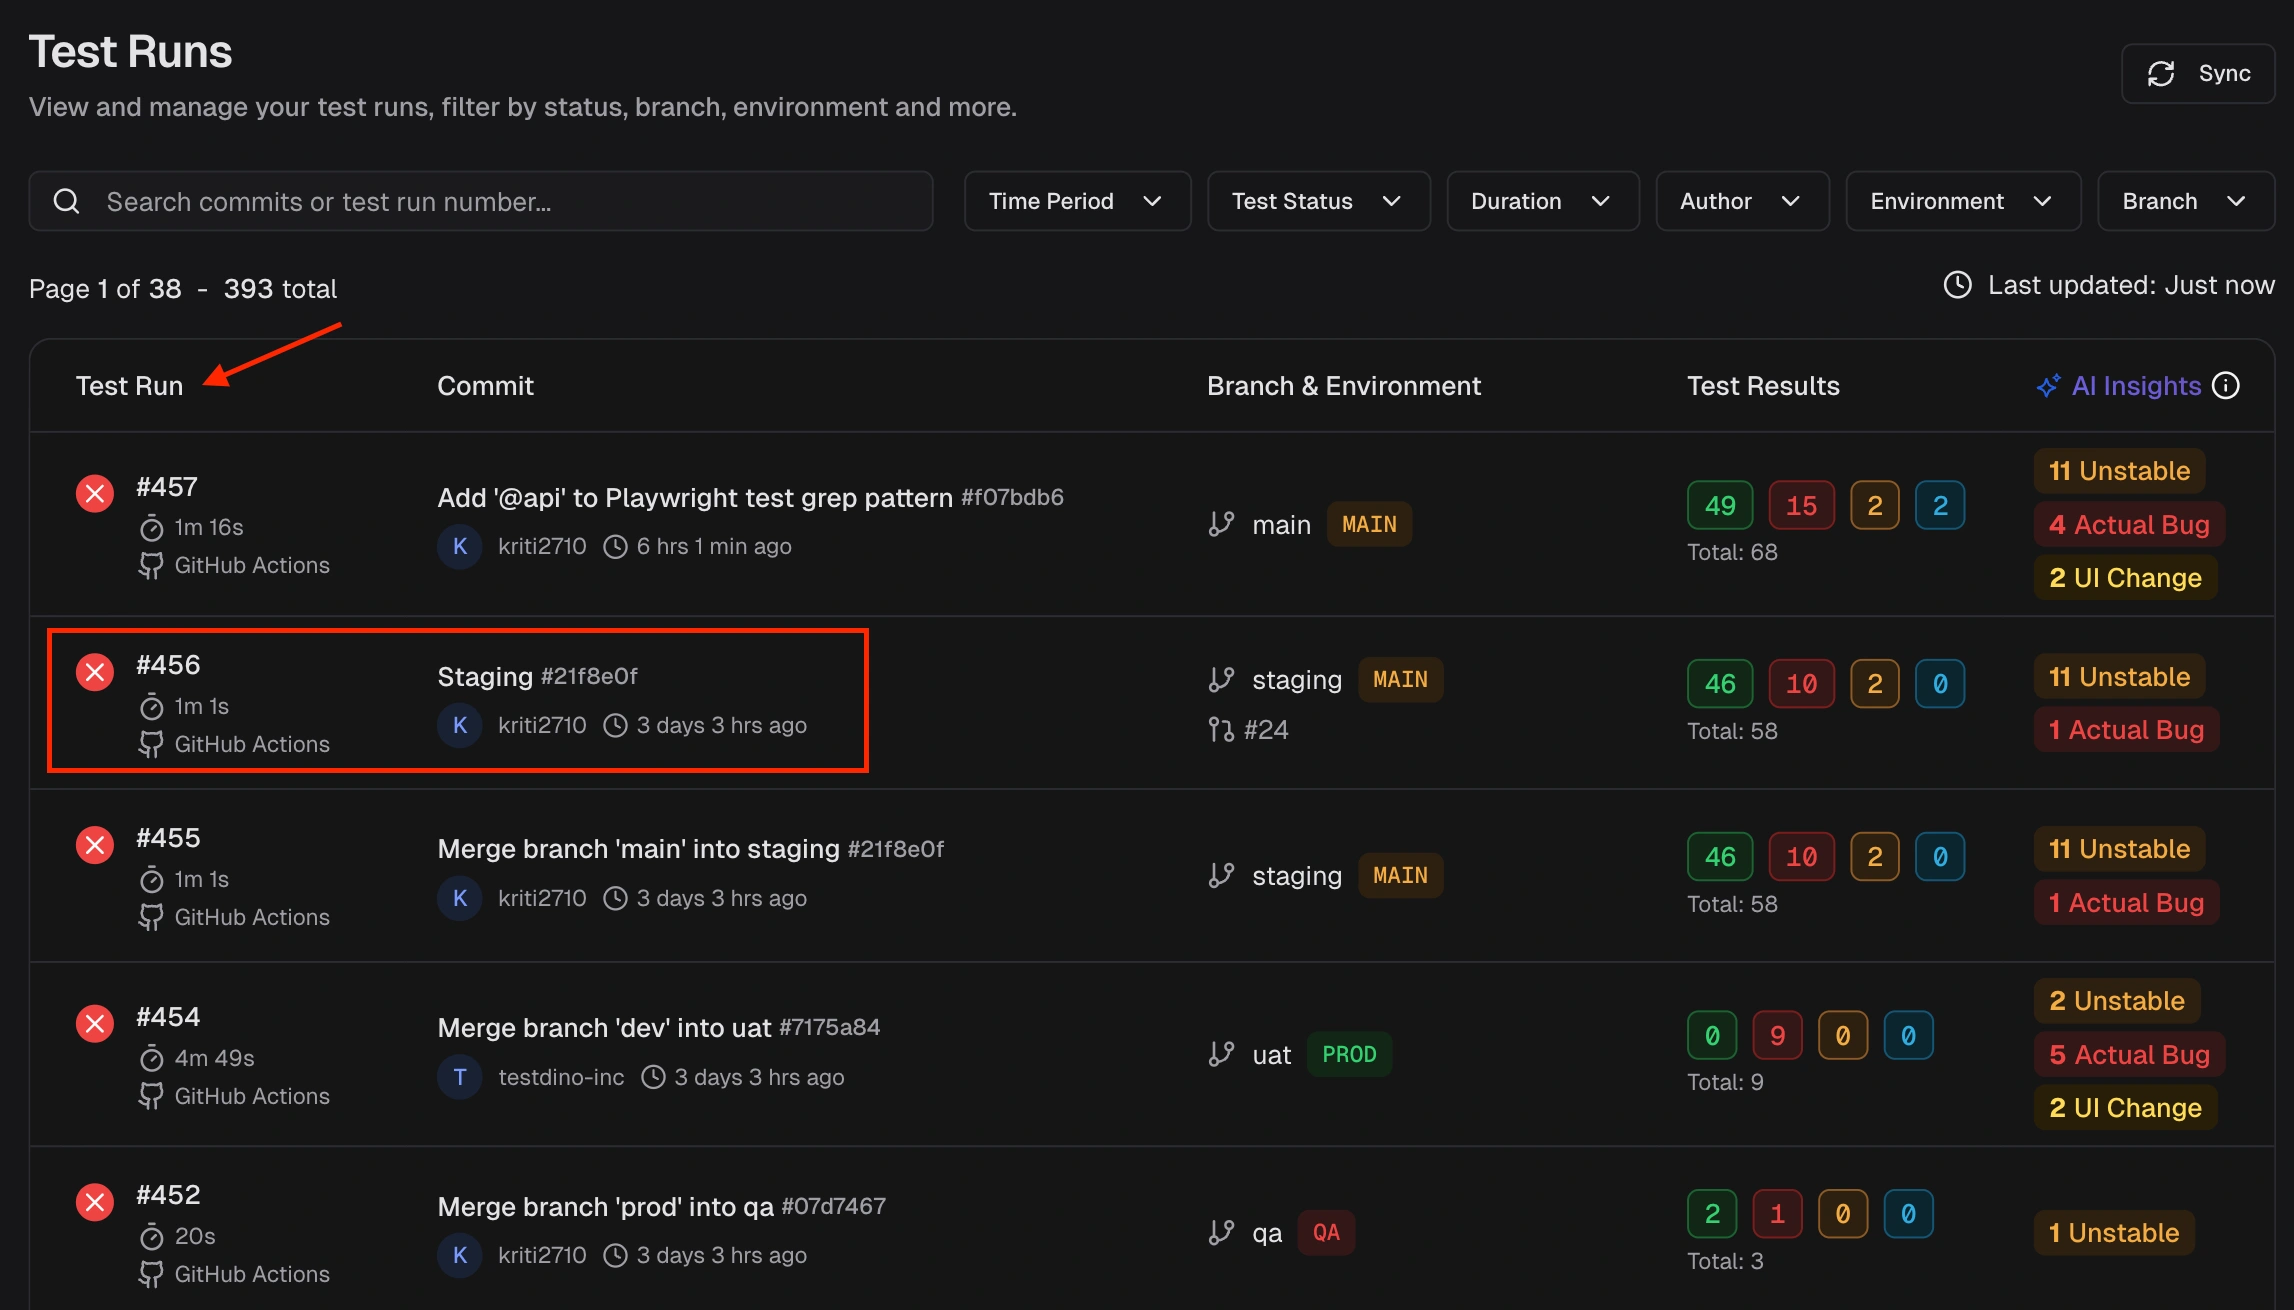 Test Case: One individual test, equivalent to one
 test() block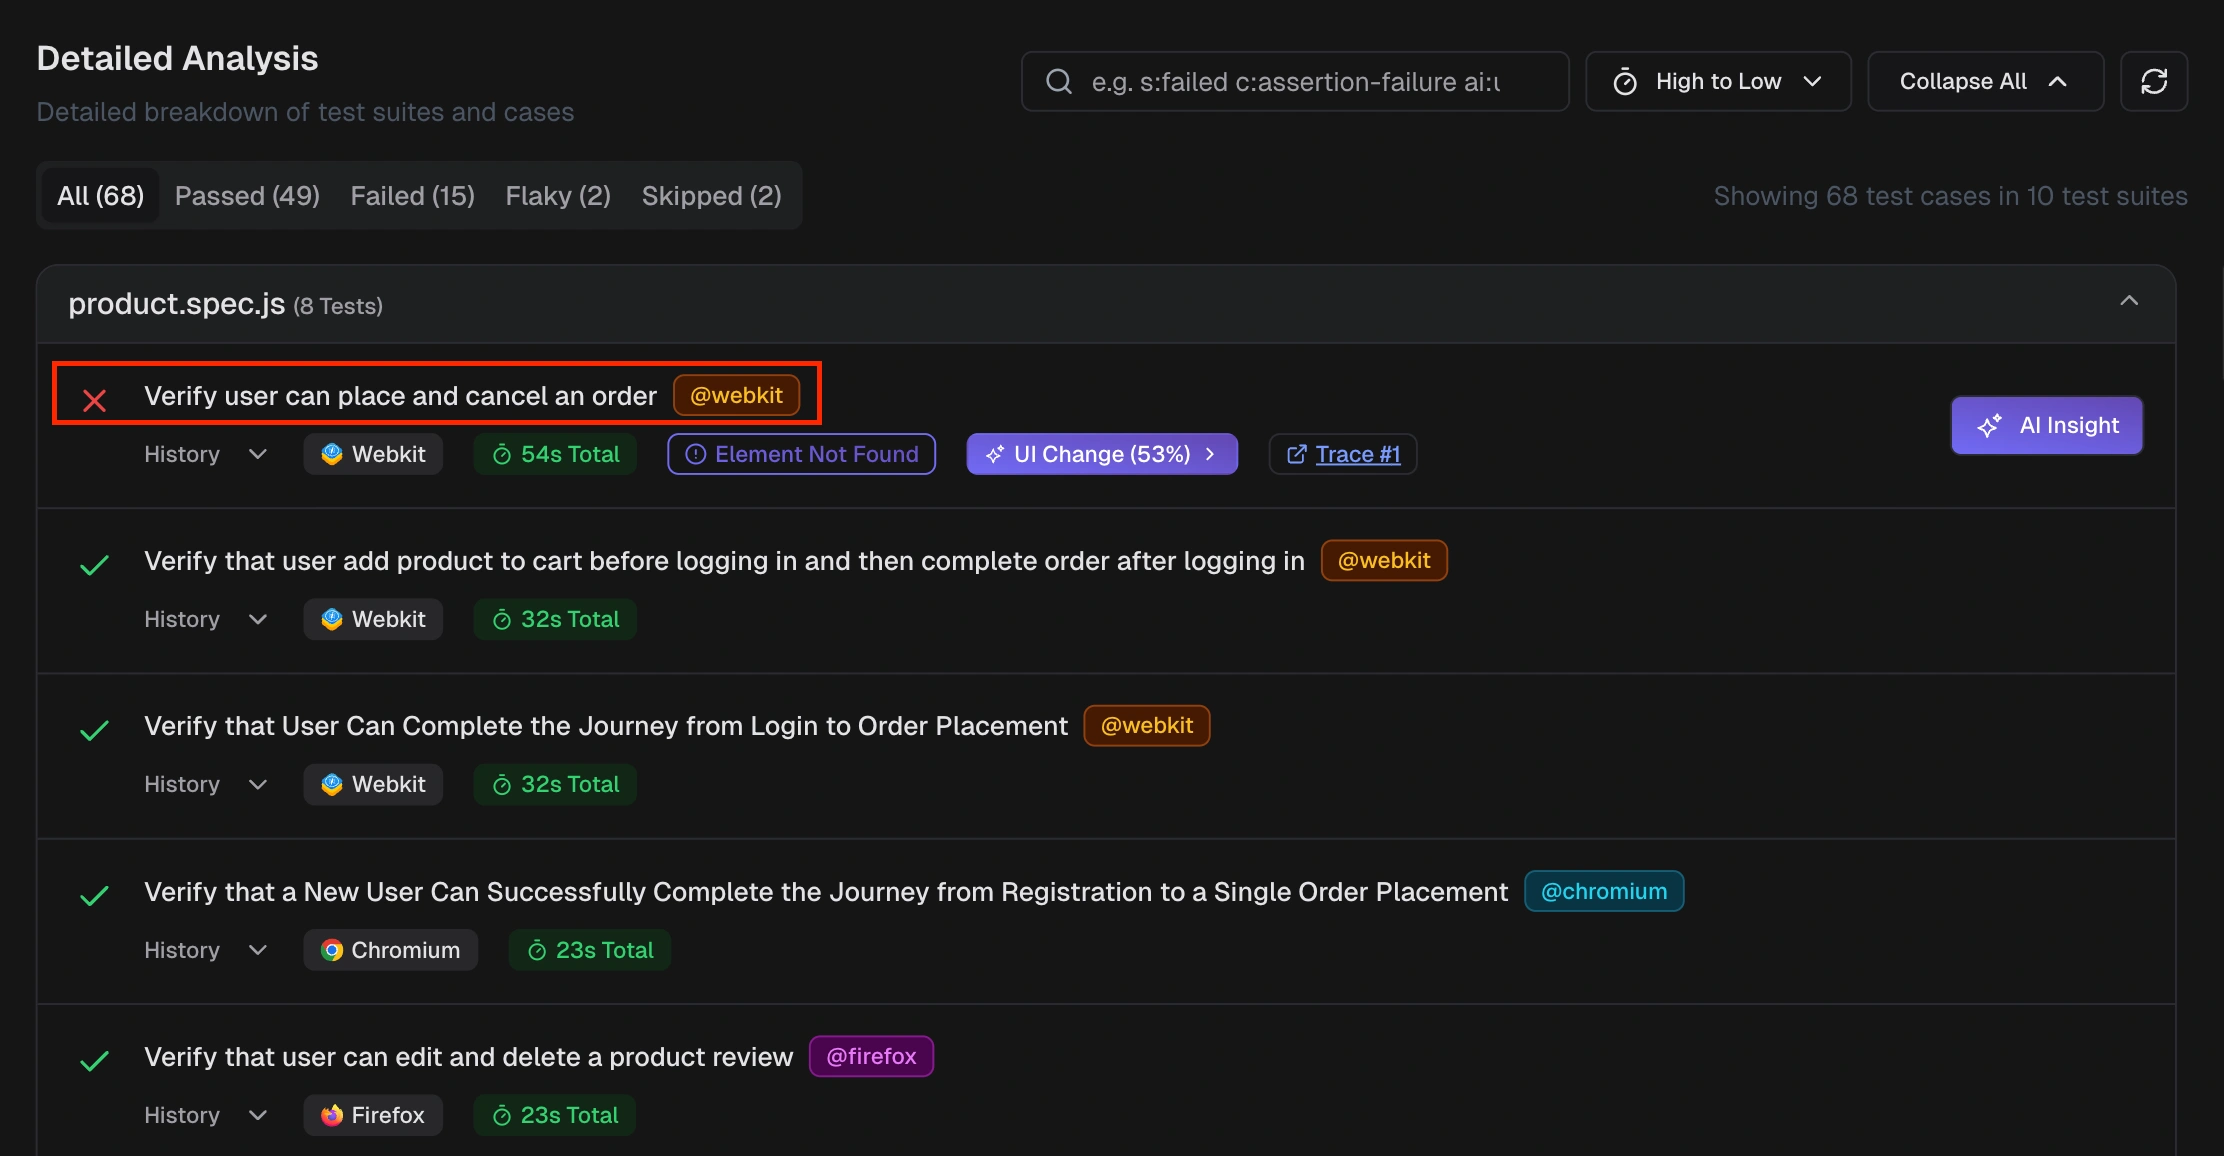 Spec file: One test file that contains one or more test cases
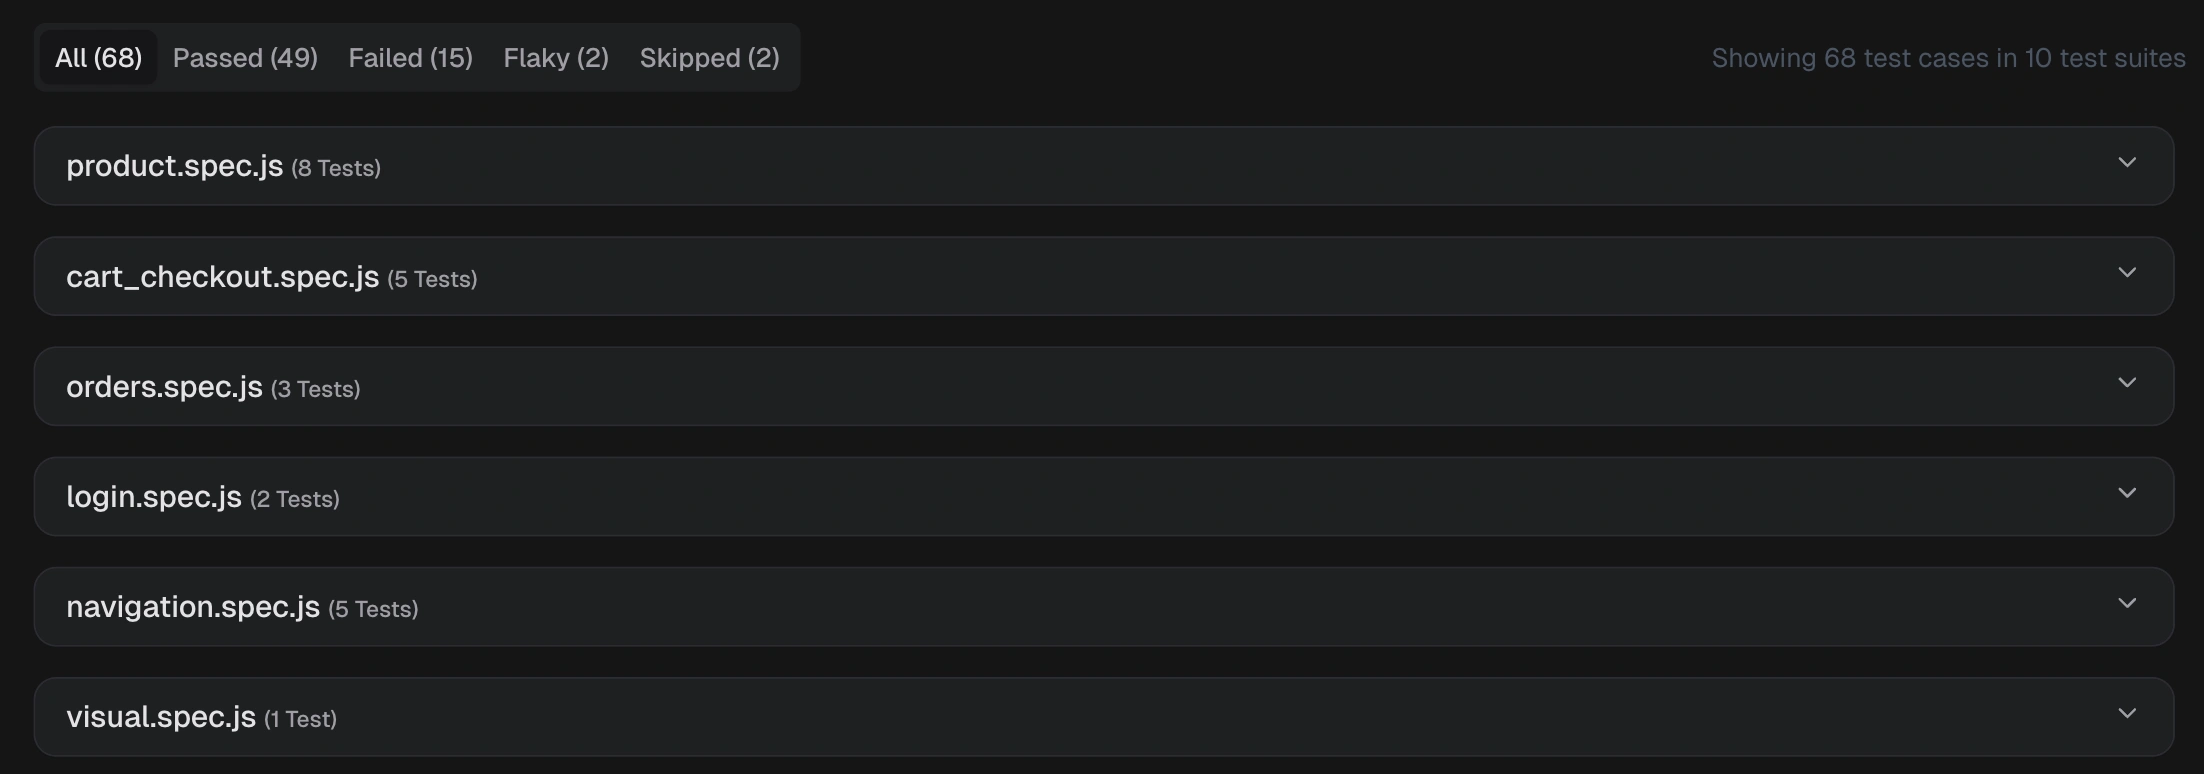
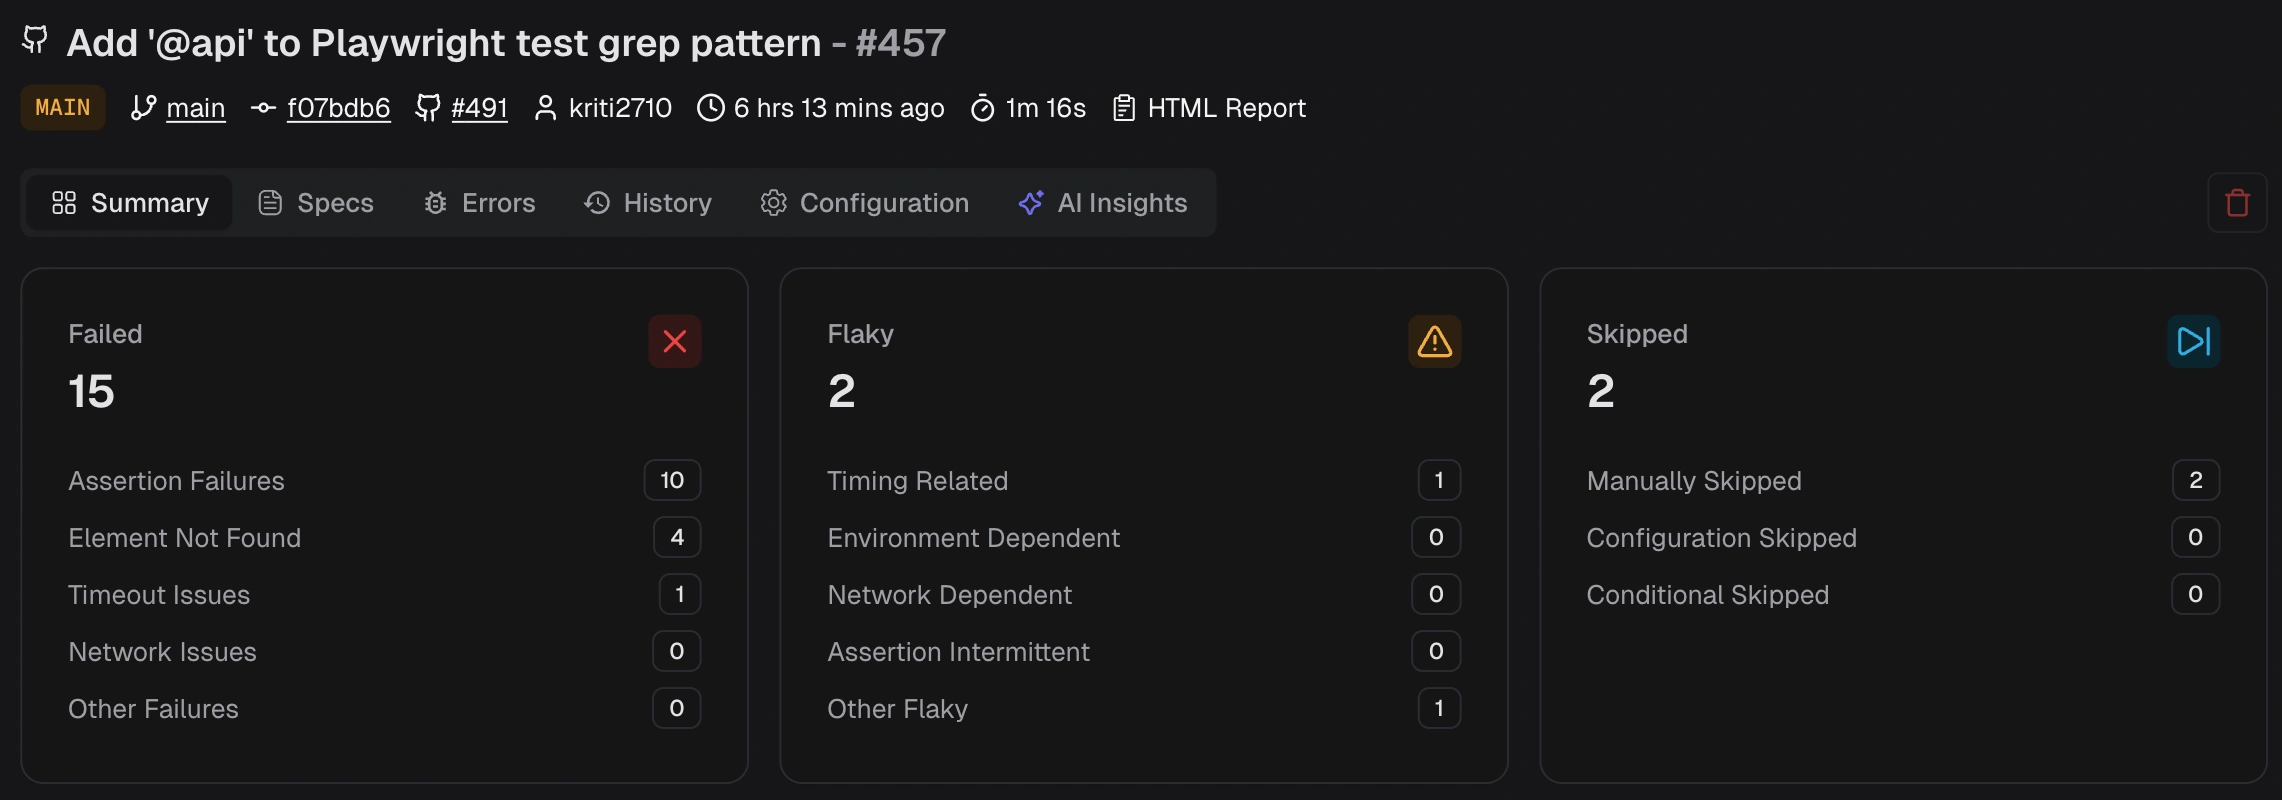
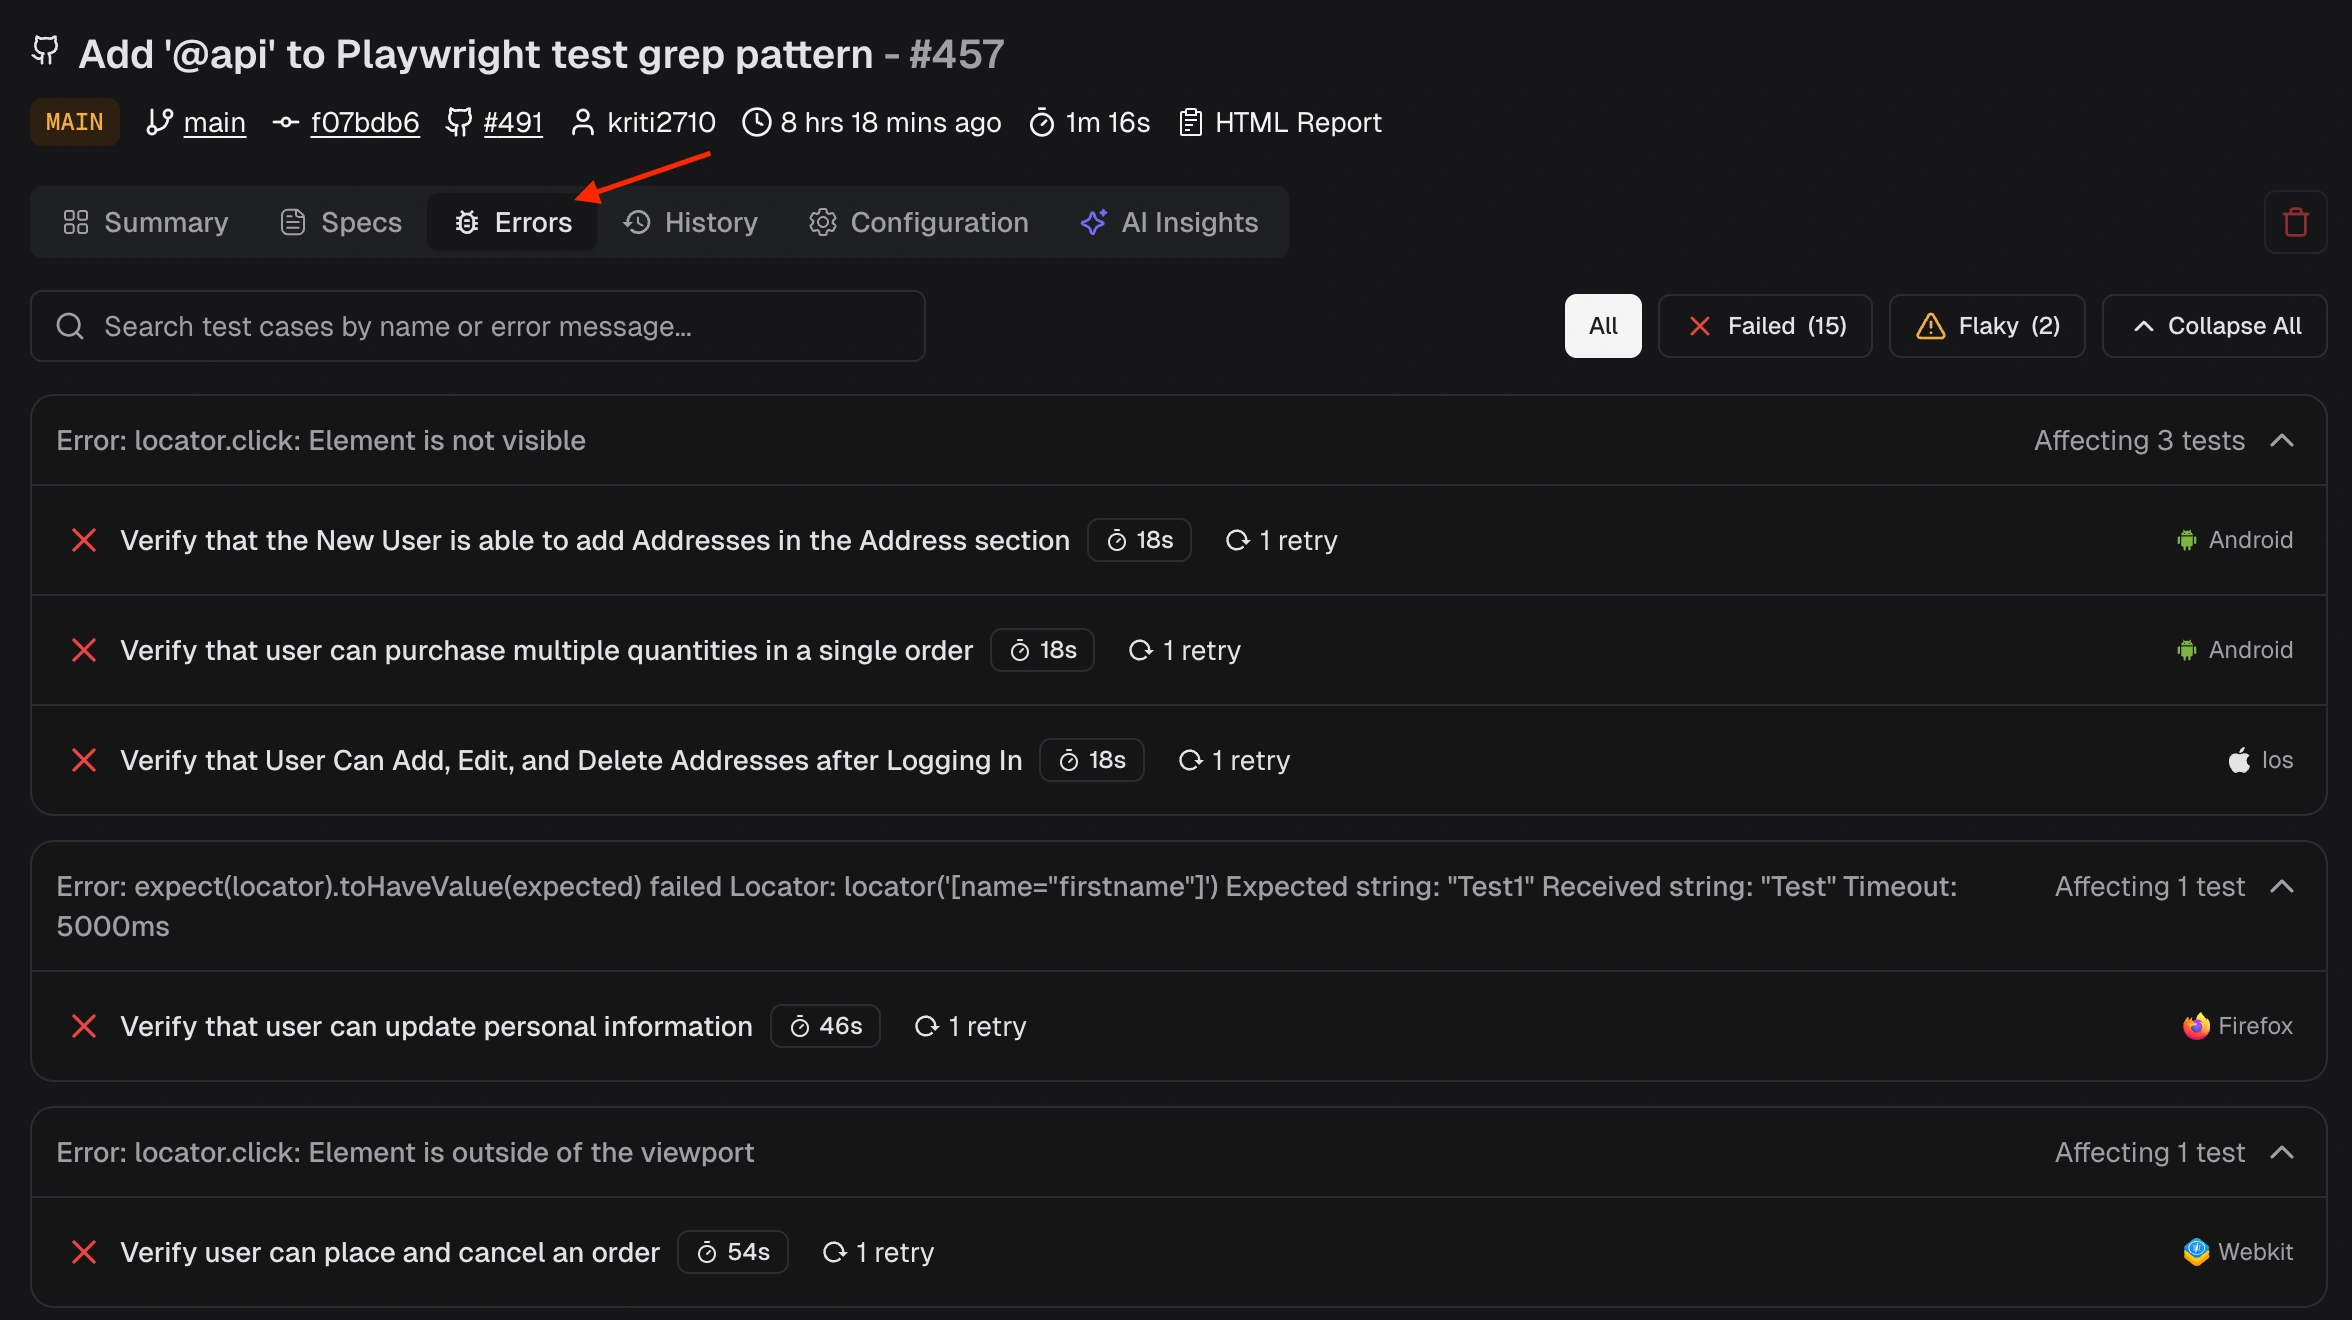
What information does the Test Run Summary provide?
What information does the Test Run Summary provide?
- Failed - Assertion Failure, Element Not Found, Timeout, Network, Other
- Flaky - Timing, Environment, Network, Assertion, Other
-
Skipped - Manual, Configuration, Conditional
s: (status), c: (cluster), @ (tag), b: (browser).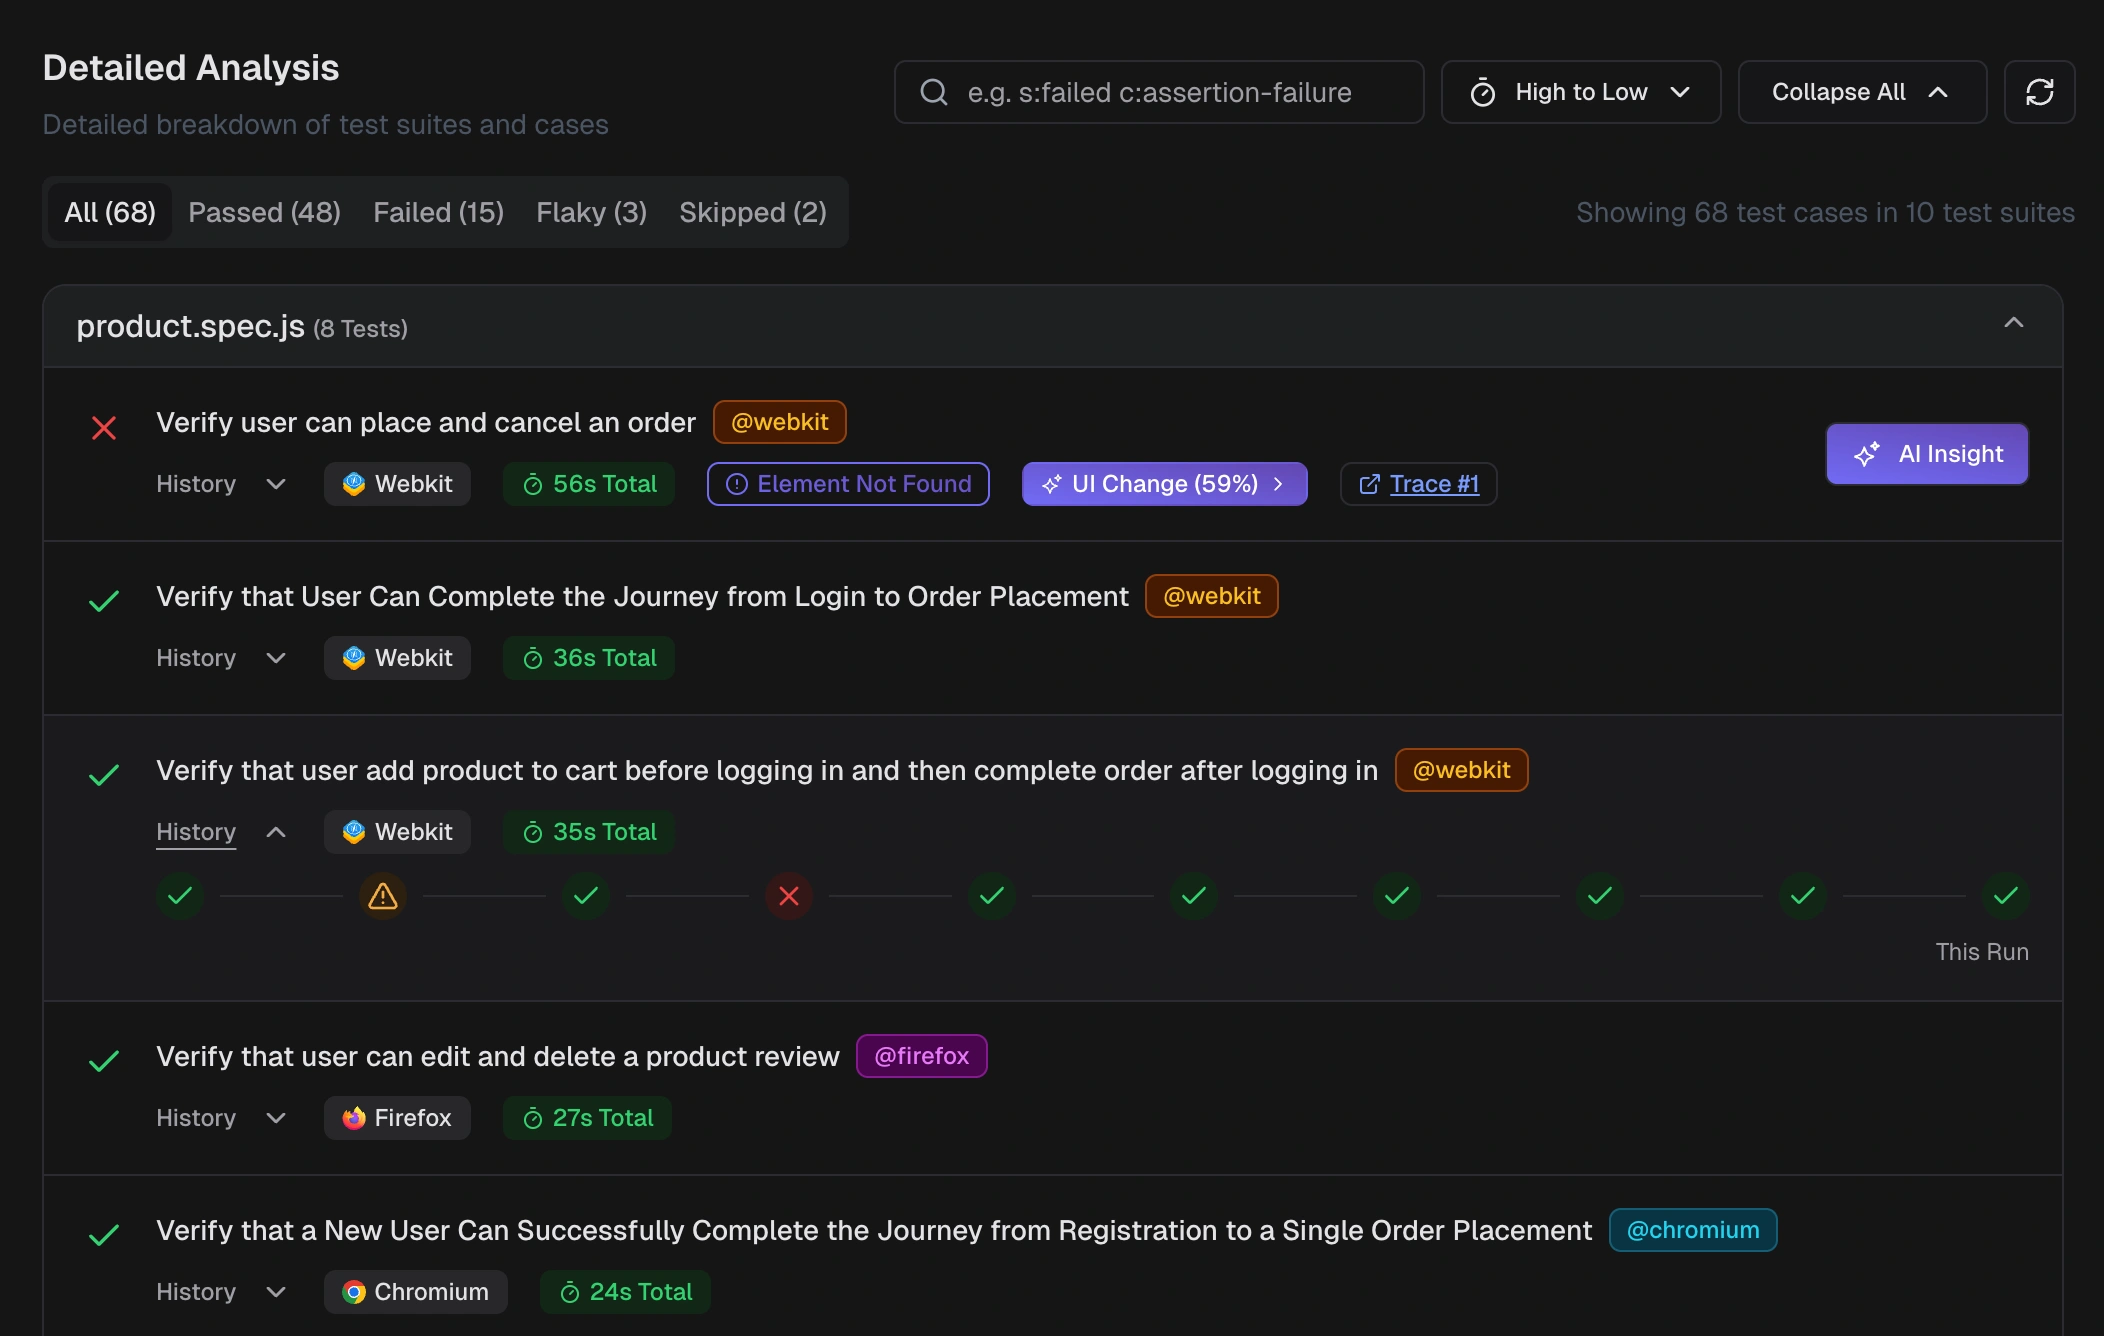
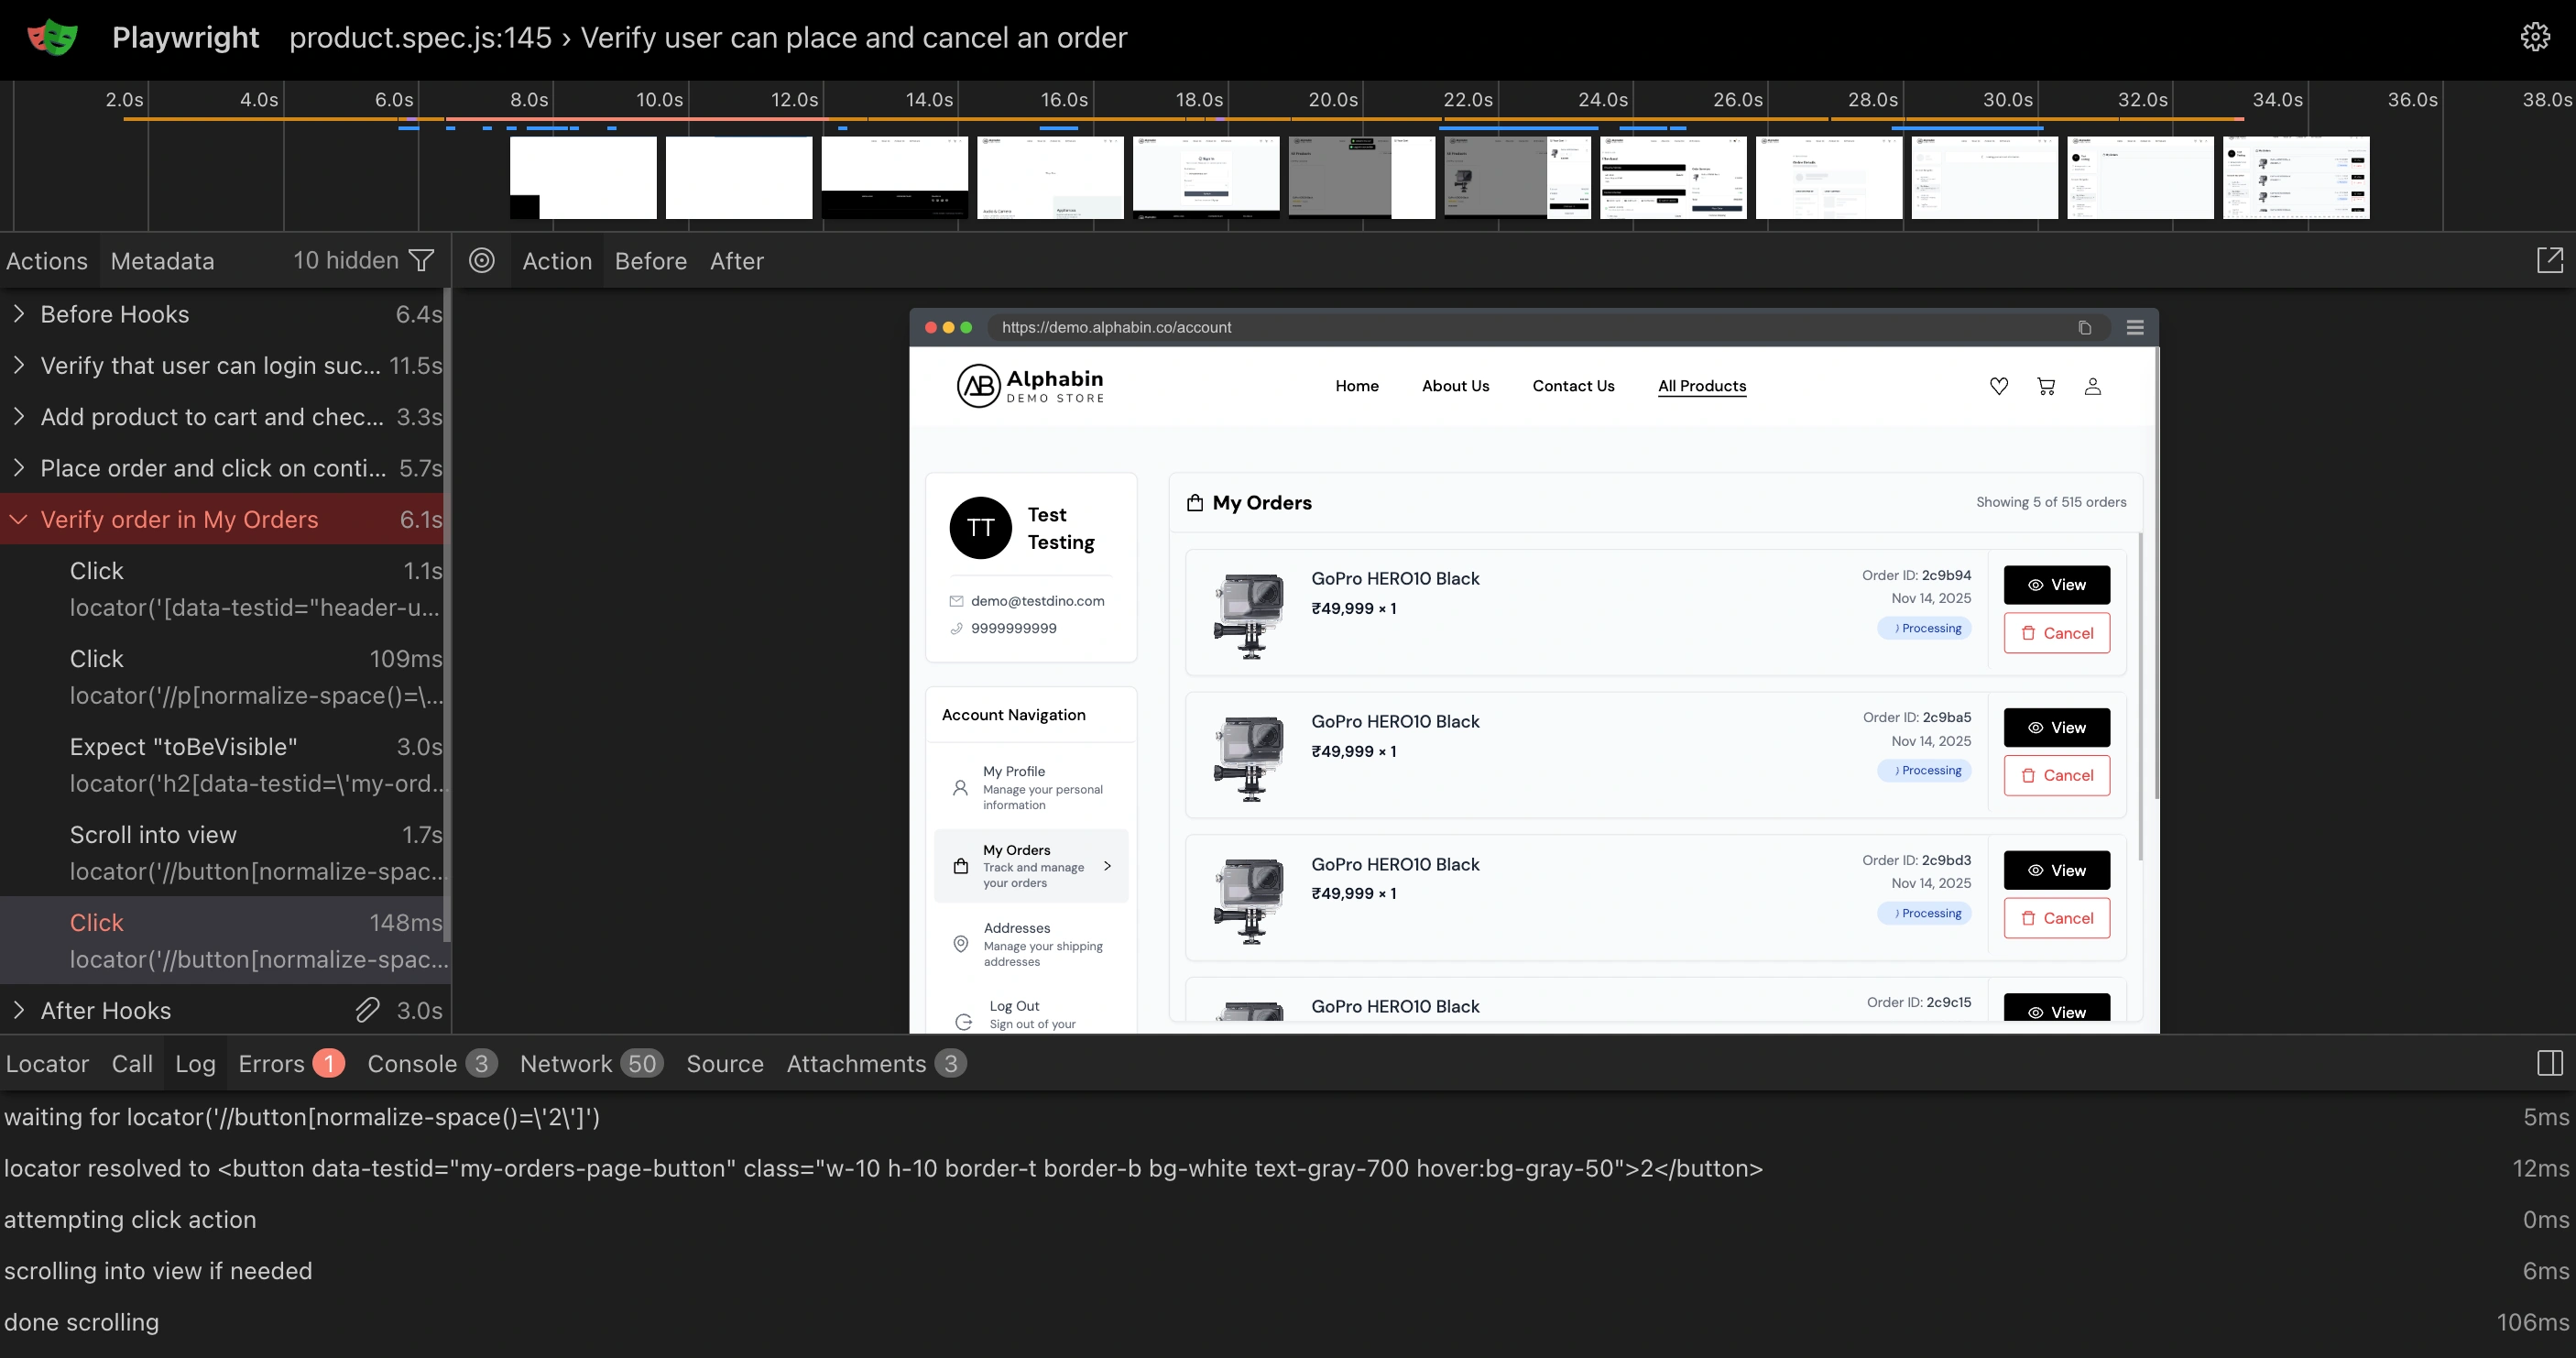
How do I view Playwright traces in TestDino?
How do I view Playwright traces in TestDino?
- Test Run Summary - Each failed/flaky test case row includes a “Trace #” link. Click it to open the full Playwright trace viewer.
- Test Case Details > Trace tab - The interactive Playwright trace shows timeline, actions, network calls, console output, and DOM snapshots. Jump directly to the failing step for root-cause analysis.
What's the difference between traces and videos in TestDino?
What's the difference between traces and videos in TestDino?
Videos are screen recordings of test execution. They show what the browser rendered, but don’t provide interactive debugging or network/console data.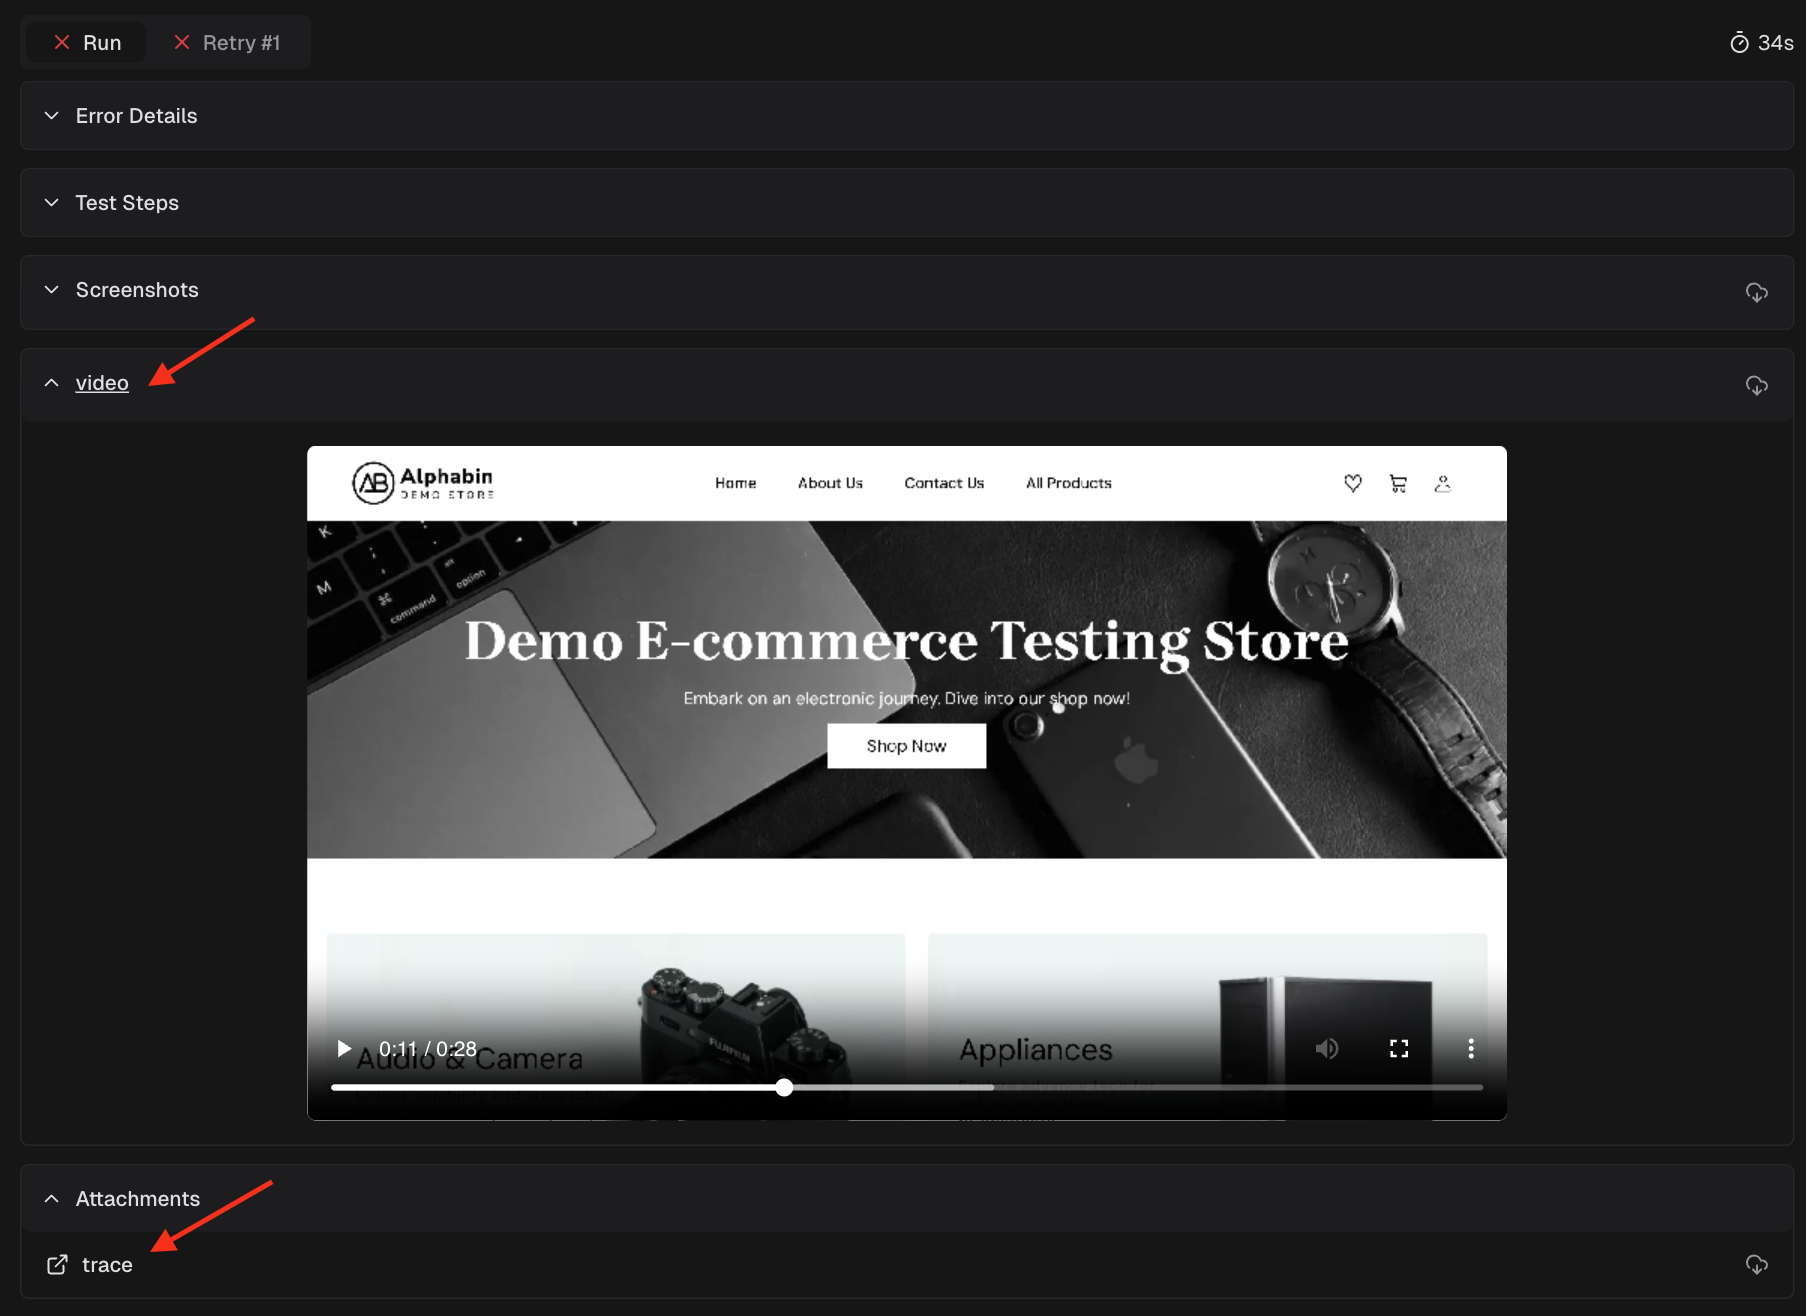 Use videos for quick visual review and, trace viewer for deep debugging of failures.
Can I search for specific test cases or errors?
Can I search for specific test cases or errors?
Why are PRs not linking to test runs?
Why are PRs not linking to test runs?
- GitHub integration must be installed and connected
- Test runs must include commit SHA metadata
- The branch must be associated with an open PR
- Check Settings > Integrations > GitHub shows connected
- Confirm CI workflow includes git context in the upload
- Ensure PR exists for the branch
Flakiness and Test Health
How does TestDino detect flaky tests?
How does TestDino detect flaky tests?
- A test that fails initially but passes on retry is marked flaky
- Retry attempts are tracked separately
- Tests with inconsistent outcomes (pass in one run, fail in another) without code changes
- Historical stability percentage calculated as (Passed ÷ Total Runs) × 100
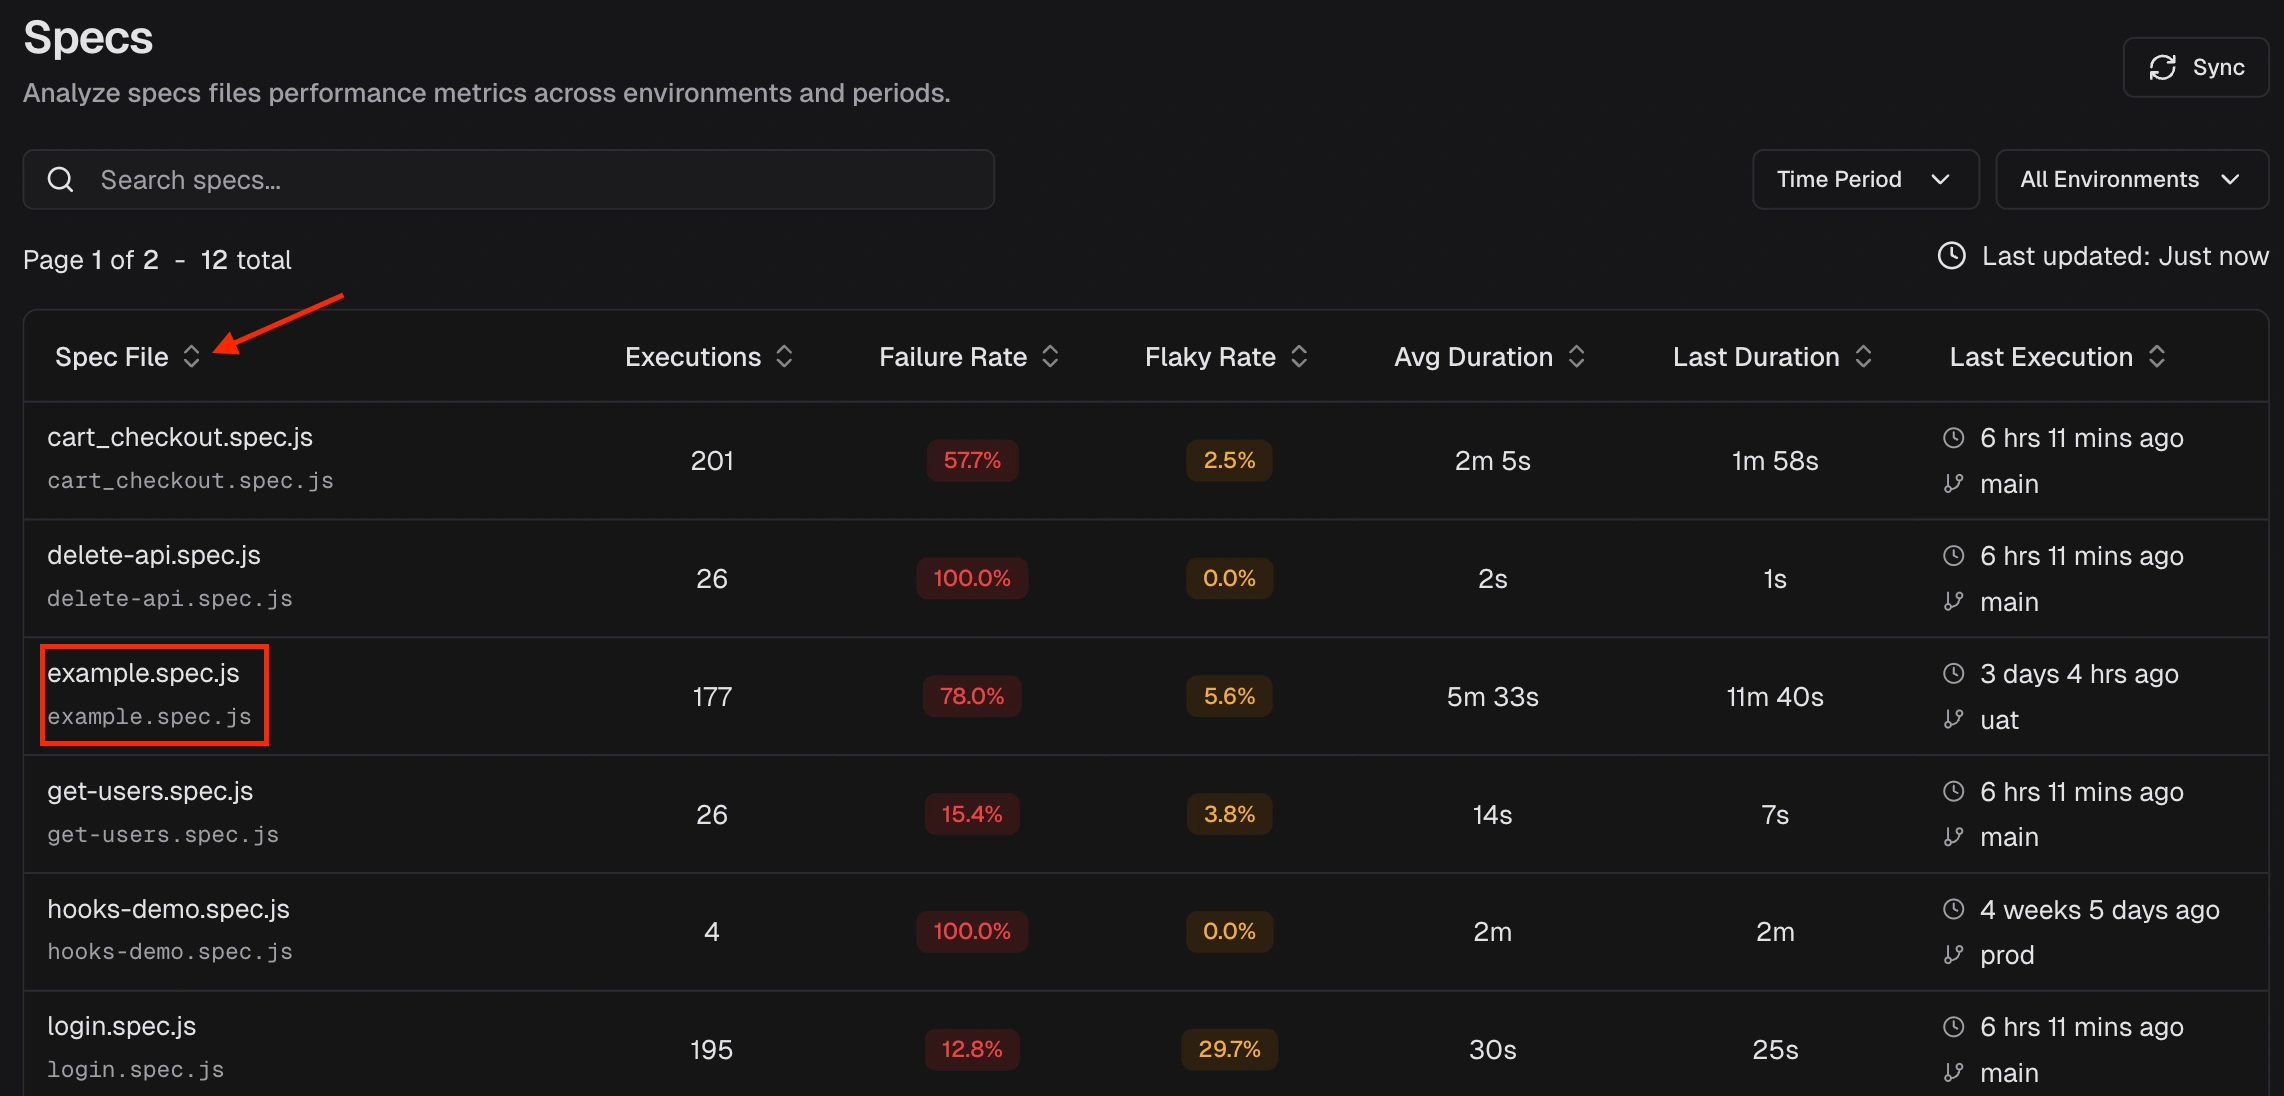
How can I view and analyze flaky tests across multiple runs?
How can I view and analyze flaky tests across multiple runs?
- Dashboard - “Most Flaky Tests” section
- Analytics - “Flakiness & Test Issues” chart with list
- Test Cases History - Stability score and “Last Flaky” tile
- Test Explorer - “Flaky Rate” column for all spec files and test cases
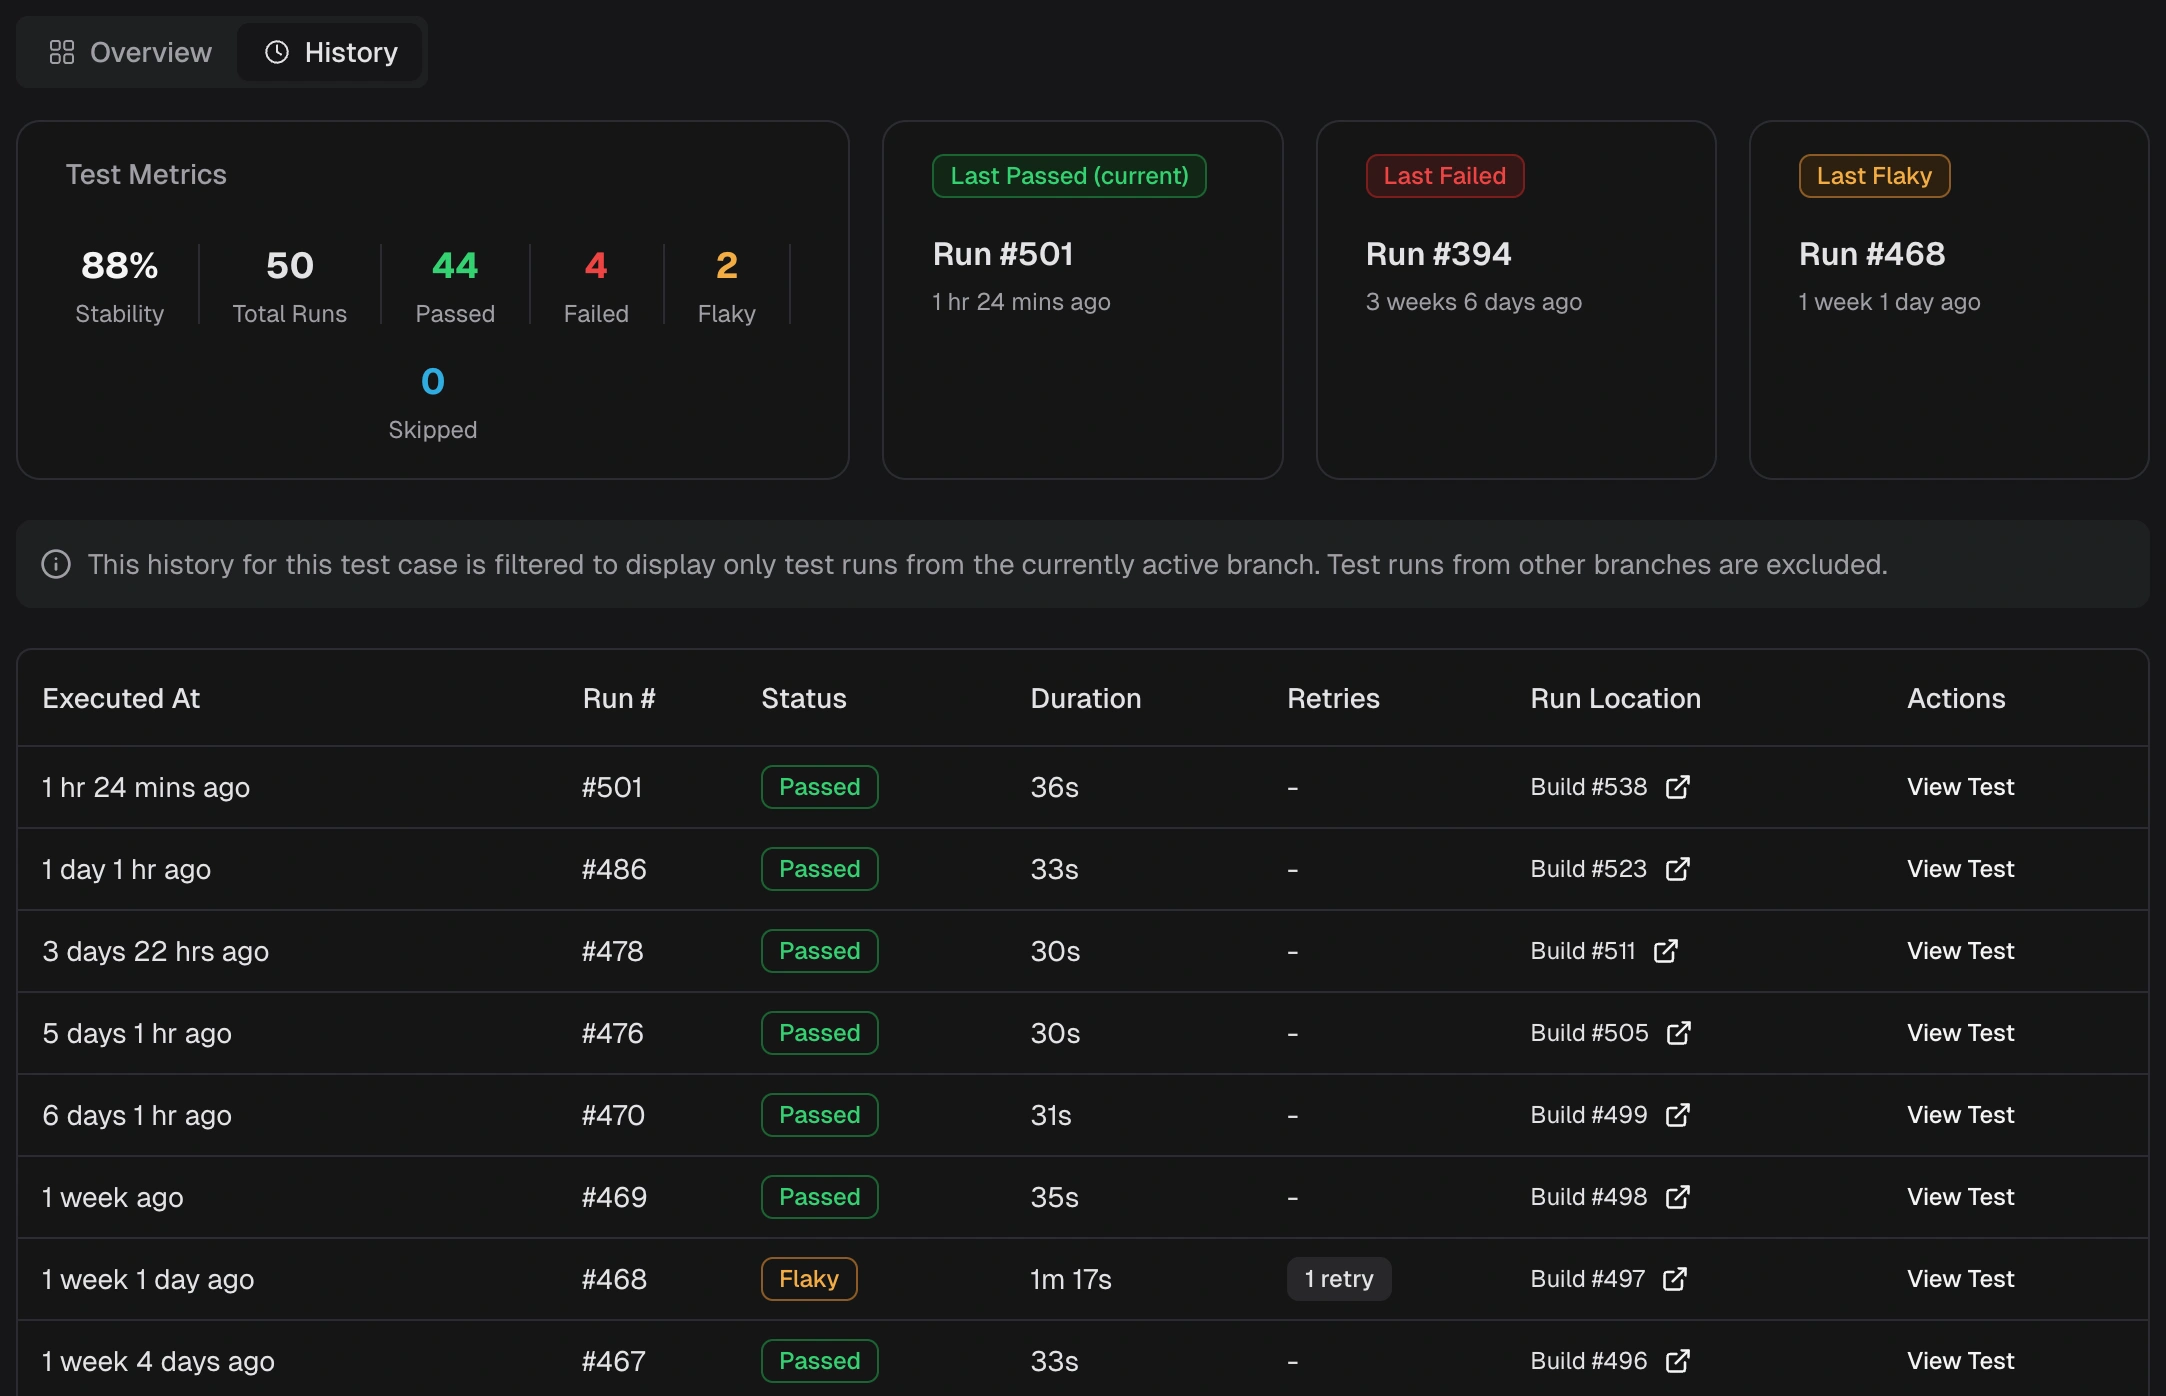
How does TestDino track historical stability for individual test cases?
How does TestDino track historical stability for individual test cases?
- Stability % - (Passed ÷ Total Runs) × 100
- Last Status Tiles - Links to Last Passed, Last Failed, Last Flaky runs
- Execution History Table - Status, duration, retries per run (expandable for error details)
Integrations
Which integrations does TestDino support?
Which integrations does TestDino support?
- CI/CD - GitHub, GitLab, Azure DevOps, TeamCity
- Issue tracking - Jira, Linear, Asana, monday
- Communication - Slack App, Slack Webhook
How do I integrate TestDino with GitHub for PR checks and comments?
How do I integrate TestDino with GitHub for PR checks and comments?
- Install the TestDino GitHub App
- Select repositories to grant access
- In Settings > Integrations > GitHub, configure:
- Comments - Enable PR and commit comments per environment
- CI Checks - Enable checks with pass rate thresholds
What Quality Gate rules are available for GitHub CI Checks?
What Quality Gate rules are available for GitHub CI Checks?
- Pass Rate - Minimum % of tests that must pass (default: 90%)
-
Mandatory Tags - Tests with these tags (e.g.,
@critical) must all pass - Flaky Handling - Strict (flaky = failure) or Neutral (flaky excluded from calculation)
-
Environment Overrides - Different rules per environment
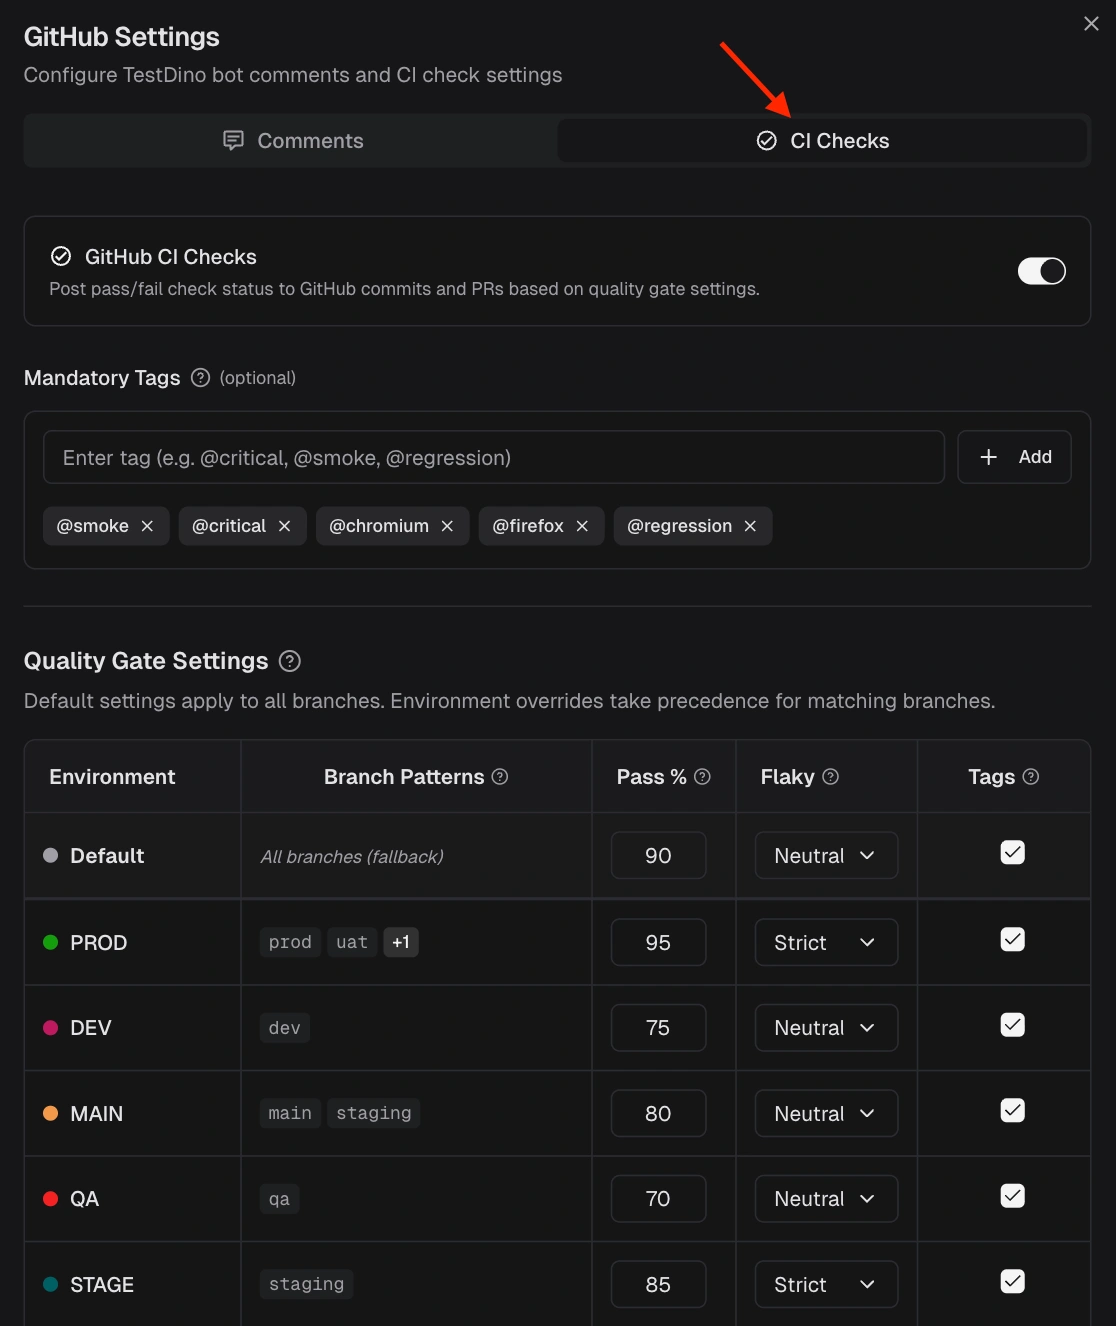
Why might a TestDino CI Check fail even if my pass rate looks high?
Why might a TestDino CI Check fail even if my pass rate looks high?
@critical as mandatory and one critical test fails, the check fails regardless of the overall pass rate.Other causes:- Flaky Handling set to “Strict” and flaky tests present
- Environment Override has stricter rules than defaults
How do I create Jira or Linear issues from failed tests?
How do I create Jira or Linear issues from failed tests?
- Connect the integration in Project Settings. Integrations
- Configure the default project (Jira) or team (Linear)
- Open a failed test case in TestDino
- Click Raise Bug or Raise Issue
- The issue is created with test details, error message, failure history, and links
Environment Mapping and Branch Management
What is Environment Mapping, and why is it important?
What is Environment Mapping, and why is it important?
- Rolls up short-lived branches (feature/*, PR branches) to the correct environment
- Enables environment-specific CI Check rules
- Routes Slack notifications to the right channels
- Filters dashboards and analytics by environment
Can I override environment mapping via the CLI?
Can I override environment mapping via the CLI?
What happens if a branch does not match any mapping?
What happens if a branch does not match any mapping?
- Add a catch-all pattern (e.g.,
.*→ Development) - Add patterns that match your branch naming convention
- Runs remain visible in the unfiltered Test Runs list
Organizations and Projects
What is the difference between organizations and projects?
What is the difference between organizations and projects?
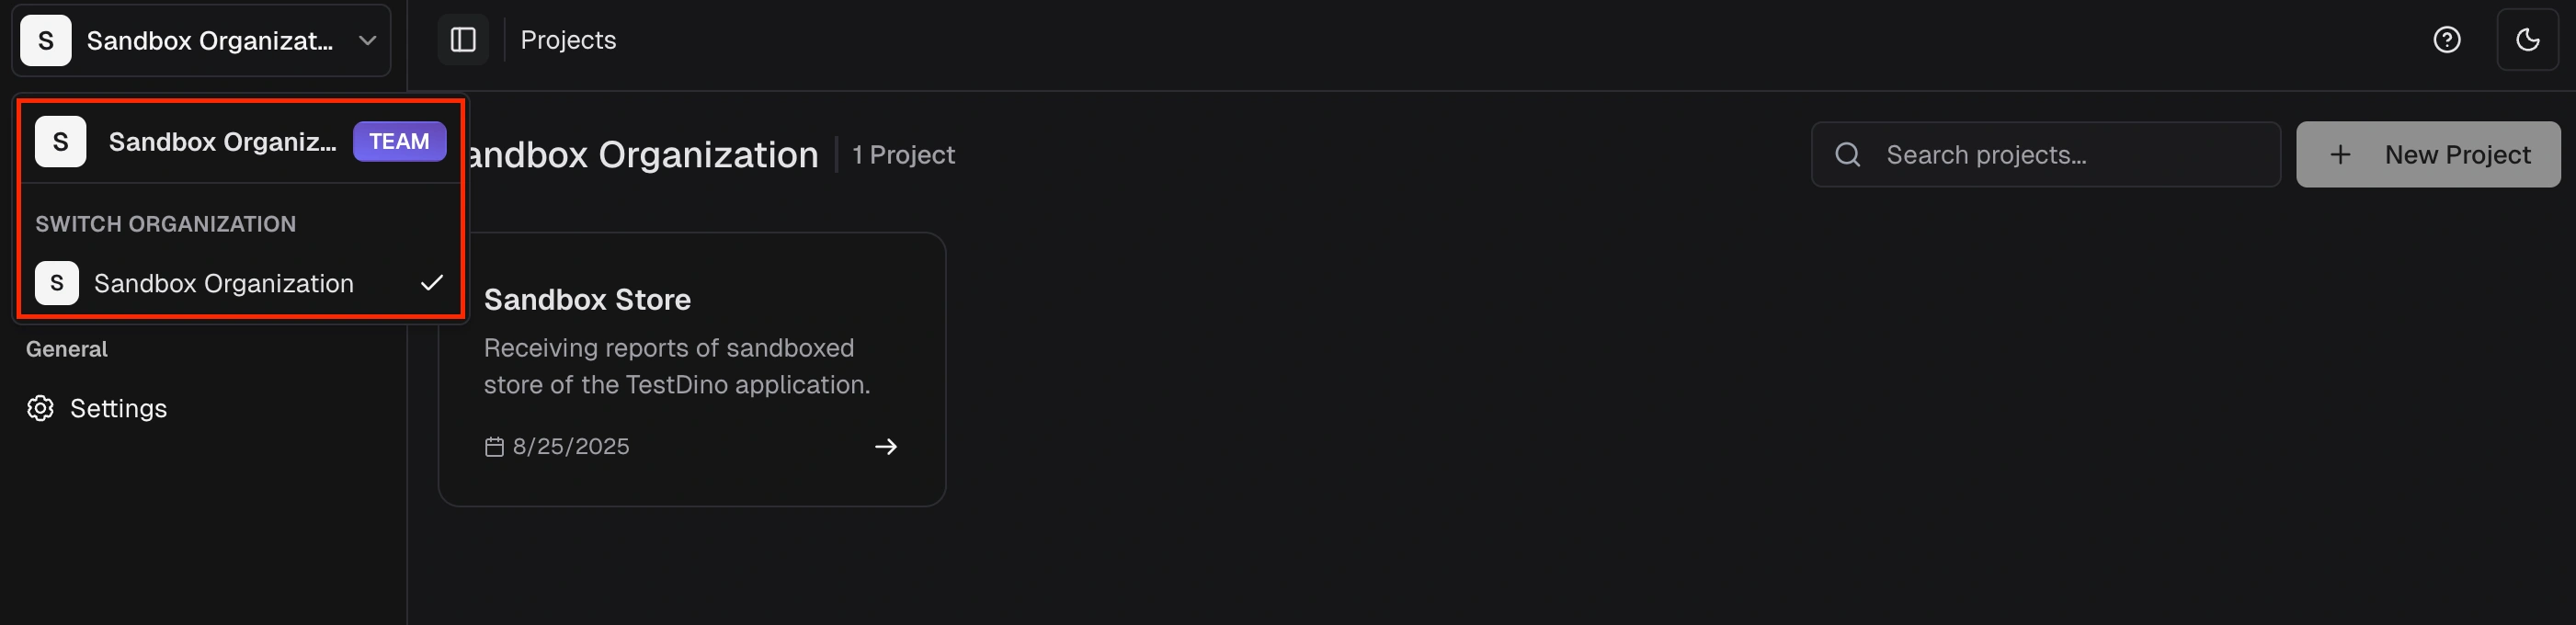 Project: One test suite or application with its own runs, keys, and integrations. Actions in one project don’t affect others
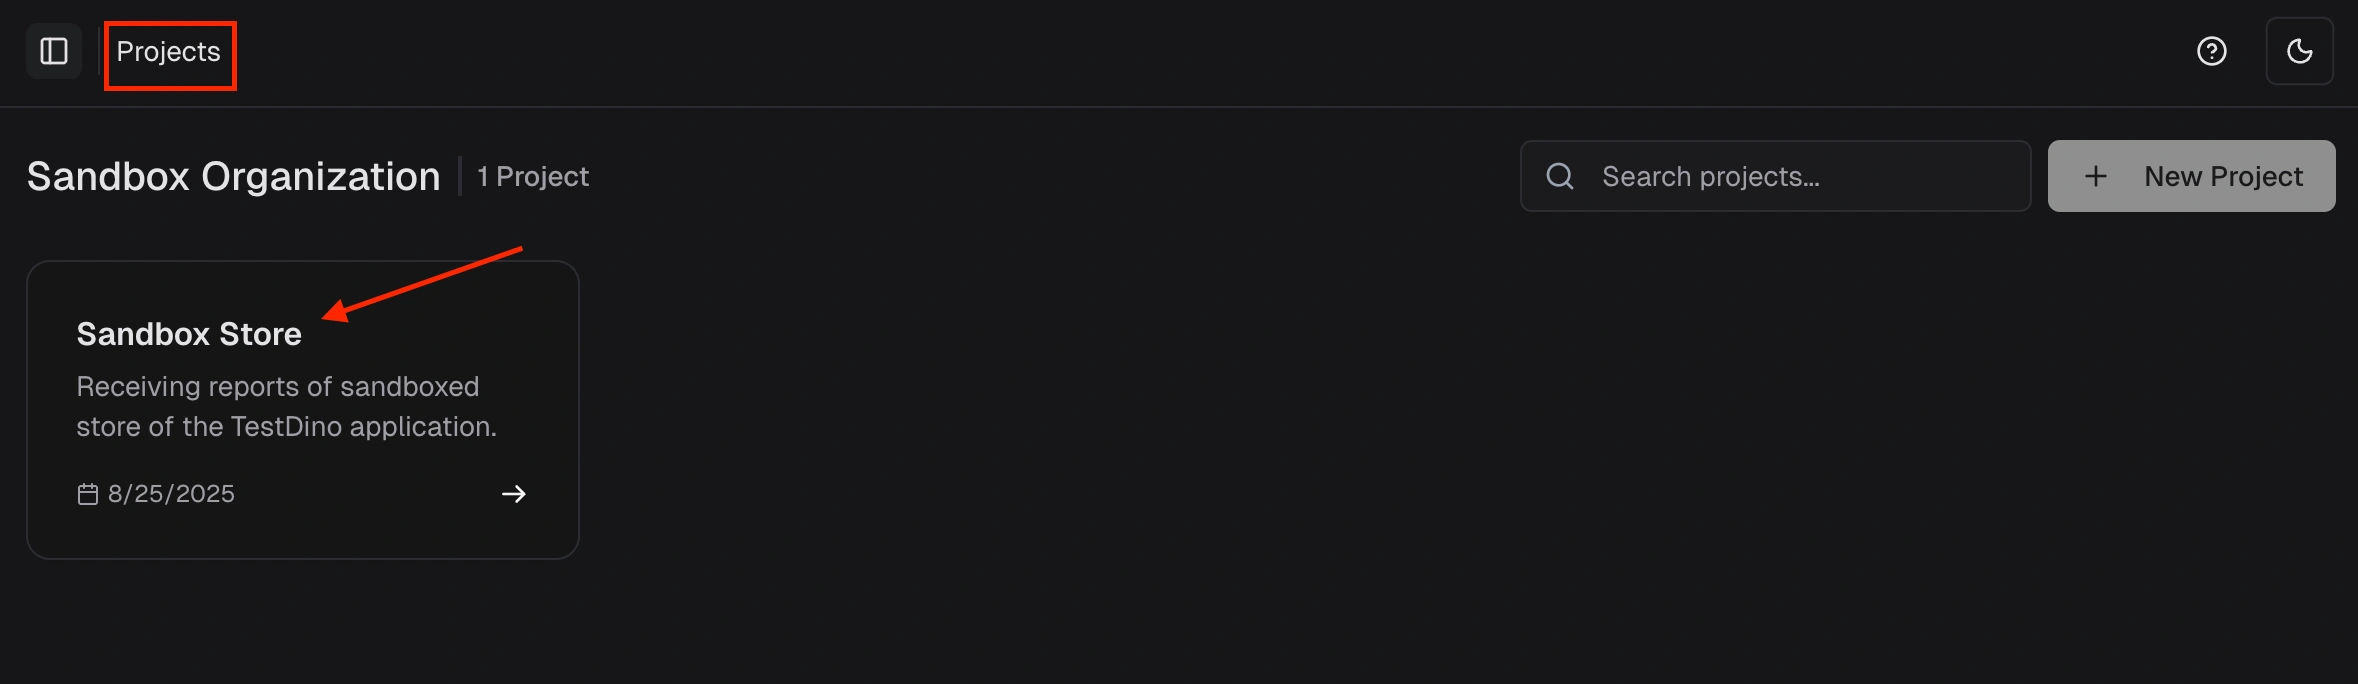 Hierarchy: Organization → Projects → Test Runs
How do I invite team members and assign roles?
How do I invite team members and assign roles?
- Go to your organization’s Users & Roles tab
- Click Invite Member and enter their email address
- Assign a role (Owner, Admin, Member, or Viewer)
- Track invitations and adjust roles as your team grows
What roles exist at the organization level?
What roles exist at the organization level?
- Owner - Full control, can invite/update/remove anyone
- Administrator - Manages people, projects, settings, and integrations, can’t remove Owner
- Member - Contributes to projects
- Billing Manager - Manages subscriptions, invoices, and payments, no test data access
- Viewer - Read-only access
Billing and Pricing
What are the plan limits, and how is usage calculated?
What are the plan limits, and how is usage calculated?
What counts as a test execution for billing?
What counts as a test execution for billing?
- Each test case counts as one execution (skipped tests are excluded)
- Retries count separately - A test with 2 retries = 3 executions
- Artifacts do not affect execution count
What happens if I exceed my plan limits?
What happens if I exceed my plan limits?
- Usage is tracked monthly and resets on your billing cycle date
- Overage, if applicable, is billed on the next invoice
- Upgrade if you consistently hit limits
What happens if I cancel my subscription?
What happens if I cancel my subscription?
- Access continues until the current billing period ends
- No future charges after cancellation
- The organization moves to the Community plan
- Retention and limits fall back to the Community plan
How do I upgrade or downgrade my plan?
How do I upgrade or downgrade my plan?
- Go to Manage Billing in your organization
- Click View All Plans
- Select the plan
- Confirm the change
Security and Privacy
Is TestDino SOC 2 compliant?
Is TestDino SOC 2 compliant?
How is my test data encrypted?
How is my test data encrypted?
Does my test data train AI models?
Does my test data train AI models?