In QA view. Choose an Environment (for example, Production, Development) and a Period (7, 14, or 30 days). The dashboard refreshes to show metrics for that scope.
KPI Tiles
Key metrics for the selected environment and period.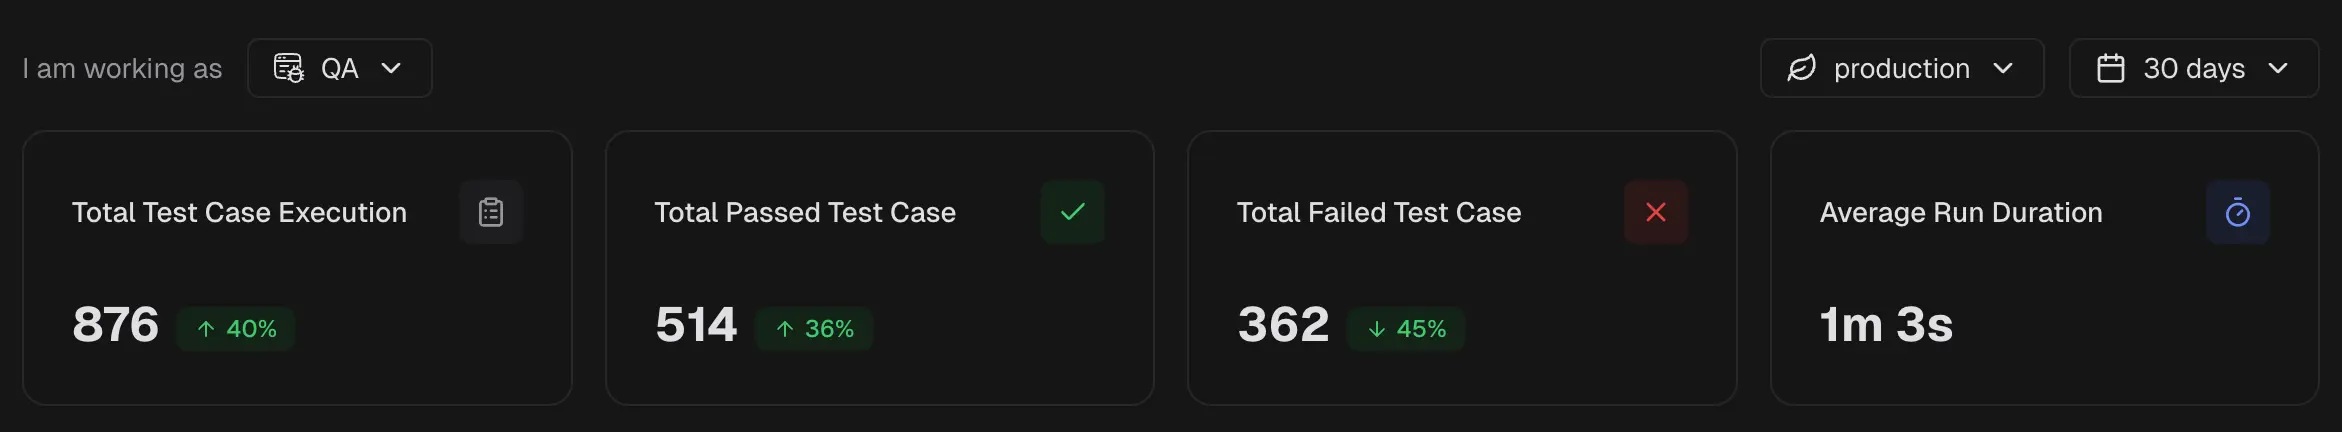
1. Test Case Executions
Number of tests cases executed in the selected period. Helps QA and managers gauge coverage and CI activity.2. Passed Test Case
Count of tests that passed. Helps managers read stability and QA confirm that recent fixes hold.3. Failed Test Case
Count of tests that failed. Direct queue for QA triage and for developers to pick up fixes.4. Average Run Duration
Average time per test run. Helps developers spot slow suites and managers track pipeline efficiency.Most Flaky Tests
Tests that pass and fail across runs, ordered by flakiness.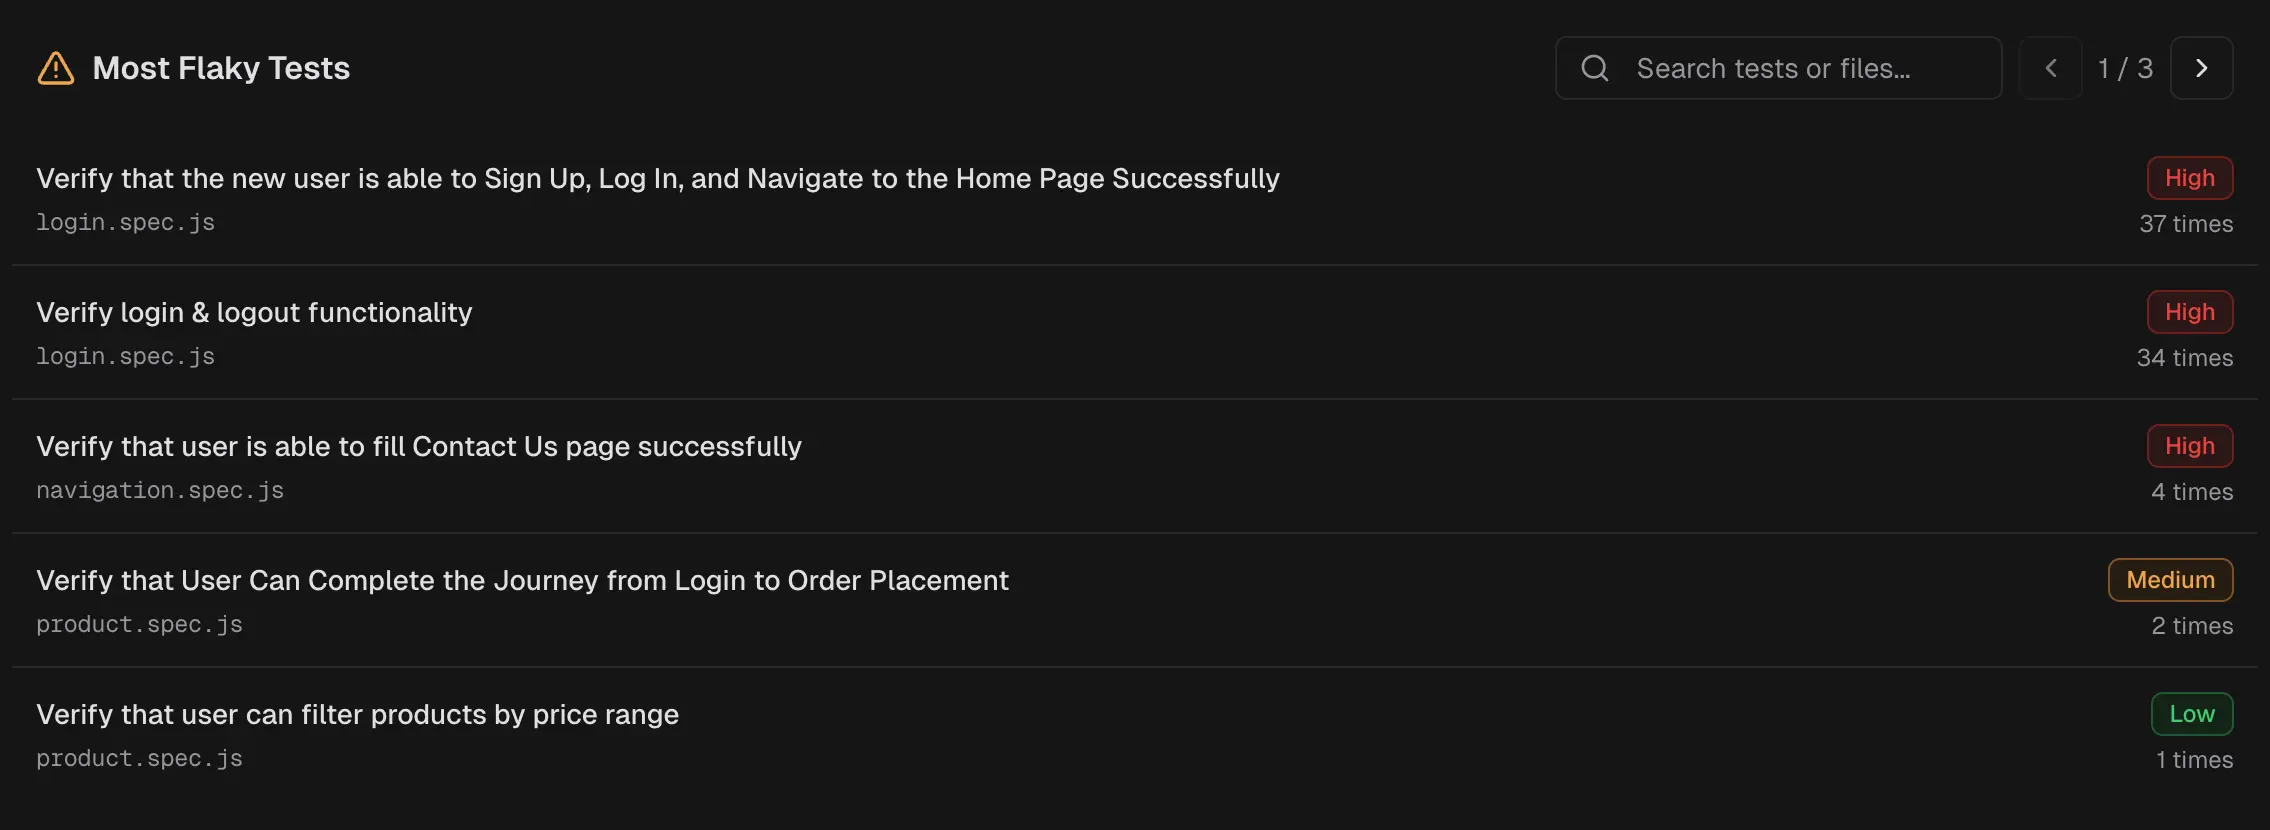 Tests that pass and fail across runs. Helps QA prioritize stabilization and developers target fragile areas.
Each test is also clickable to immediately view the latest run for that test.
Tests that pass and fail across runs. Helps QA prioritize stabilization and developers target fragile areas.
Each test is also clickable to immediately view the latest run for that test.
AI Insights
The QA Dashboard includes two AI-driven panels that explain failures and highlight patterns for the selected period, environment, and branches.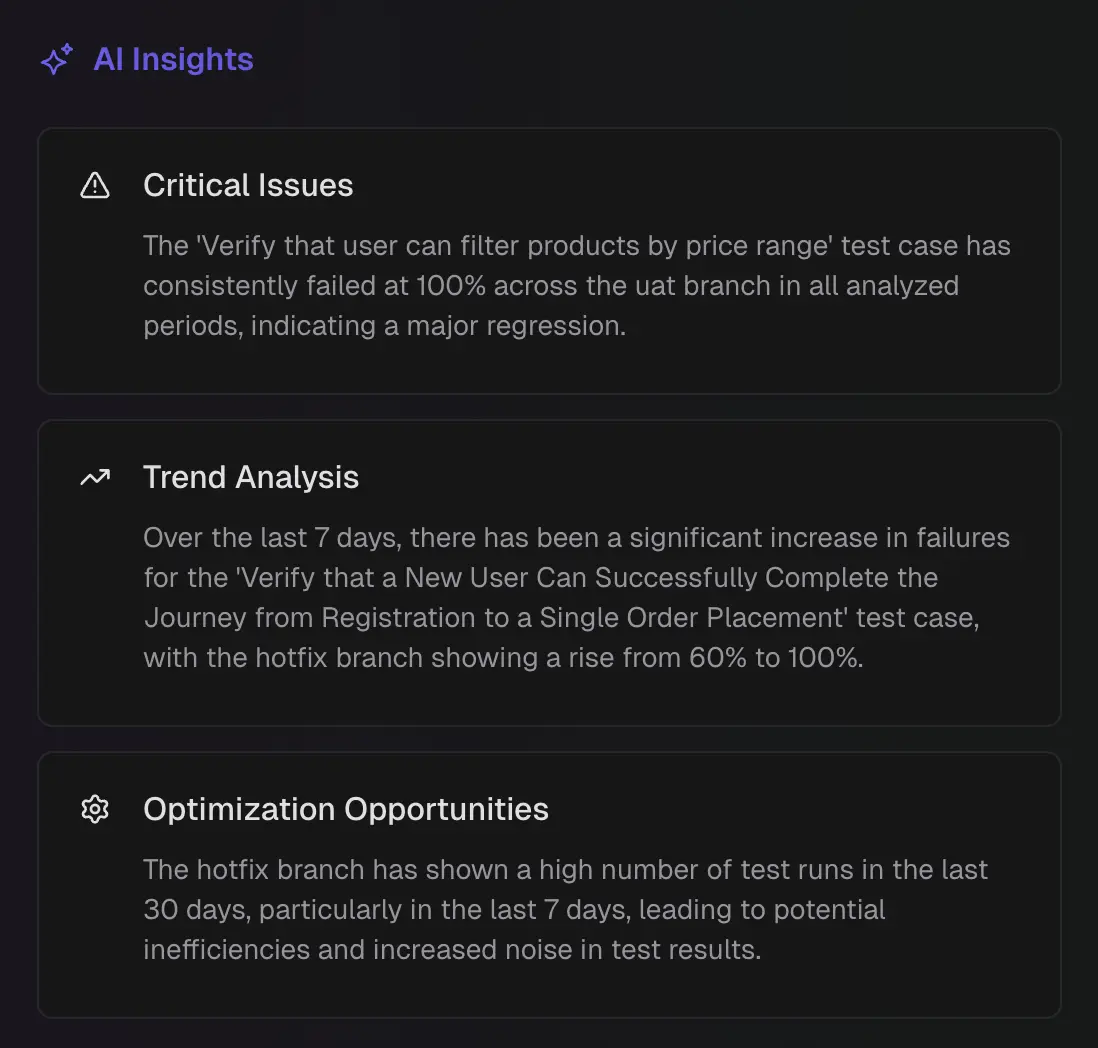
Test Failure Categories
An AI summary that categorizes failures by type and shows counts with the recent change. It separates real defects from test or environment noise so you can route work to the right owner.-
Actual Bug
A repeatable product defect; the same assertion or stack trace fails across runs. Fix the code and verify on a clean run. -
UI Change
The interface changed, and the test no longer matches (locator/text/timeout). Update selectors and assertions to the new UI. -
Unstable Tests
Intermittent failure from timing, order, shared state, network, or data setup. Stabilize with explicit waits, isolated state, and reliable data/mocks. -
Miscellaneous
Environment or pipeline problems, such as secrets, CI timeouts, or permissions. Correct the configuration/infra and re-run.
AI Insight Summaries
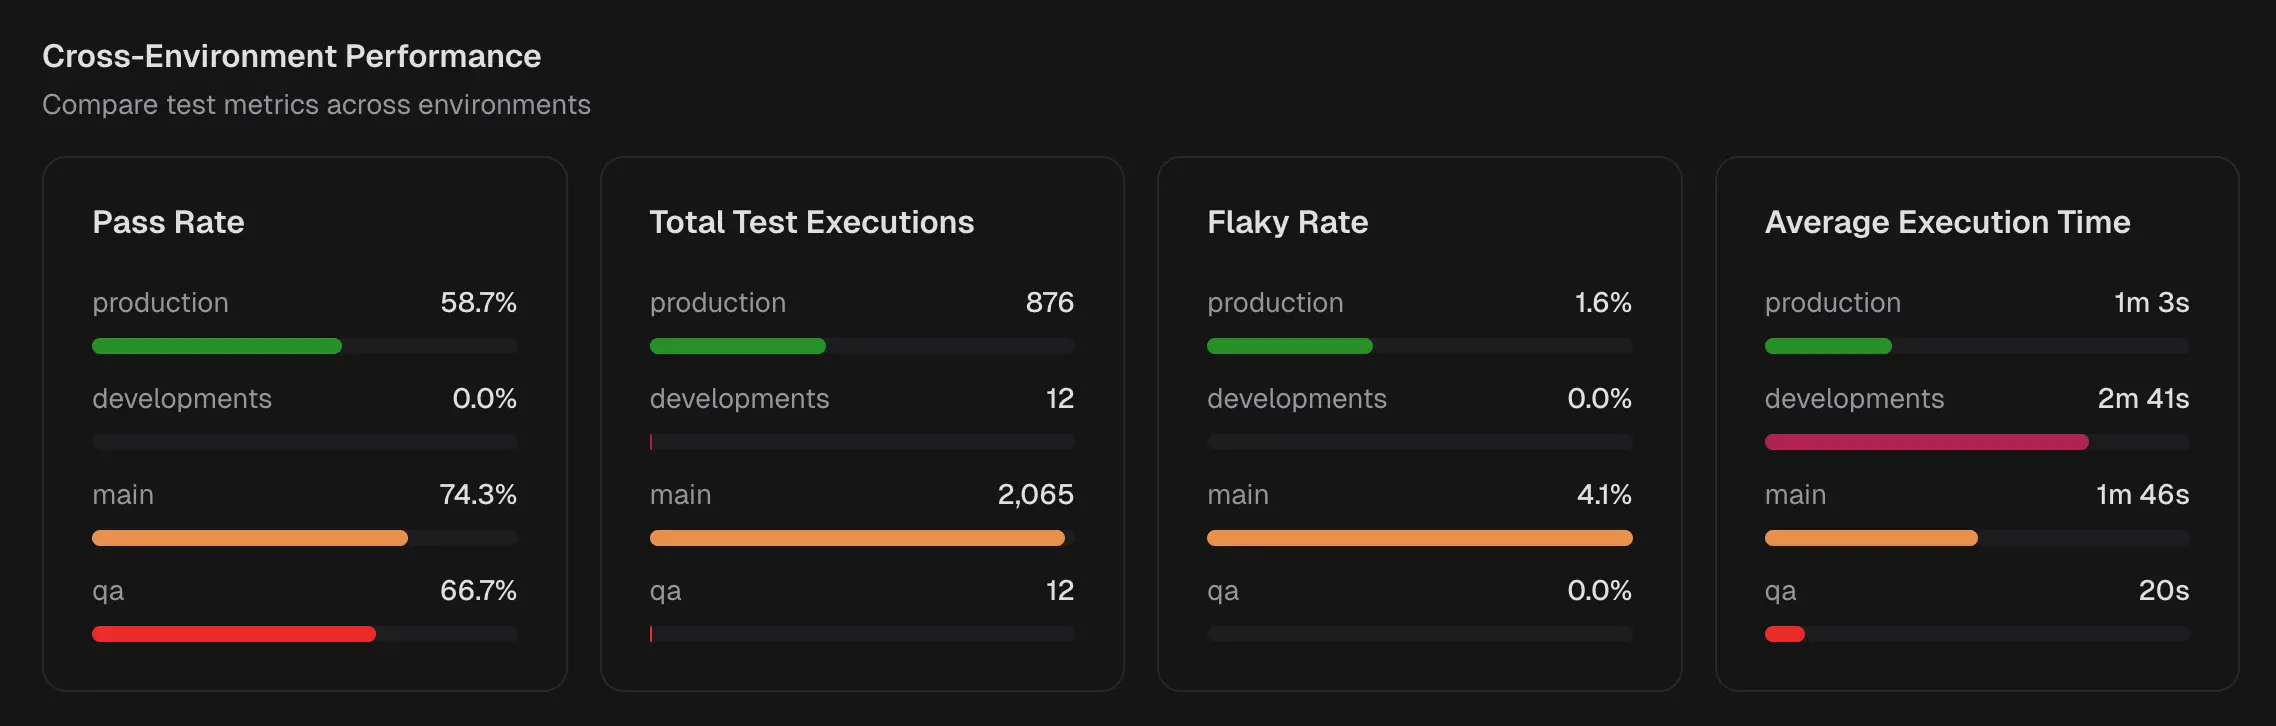
This panel calls out notable patterns and opportunities based on recent history. 1. Critical issues Failures with the highest impact on release readiness. Guides managers on risk and QA on urgent triage. 2. Trend analysis Patterns that are rising or repeating over time. Helps QA verify regressions and developers confirm that fixes stick. 3. Optimization opportunities Tests or areas where speed or stability can improve. Helps developers reduce runtime and QA cut noise.Cross-Environment Performance