What you’ll learn
- How to use hierarchical and flat views to find tests
- What each column (failure rate, flaky rate, avg duration, etc.) measures
- How to filter by time period, tags, platforms, and environment
- How the test case detail drawer works
View Modes
Test Explorer supports two viewing modes. Toggle between them using the view switcher in the top-right corner.Hierarchical View (Default)
Groups test cases by their spec files. Each spec row displays aggregated metrics across all tests in that file. Expand a spec row to reveal individual test cases within it.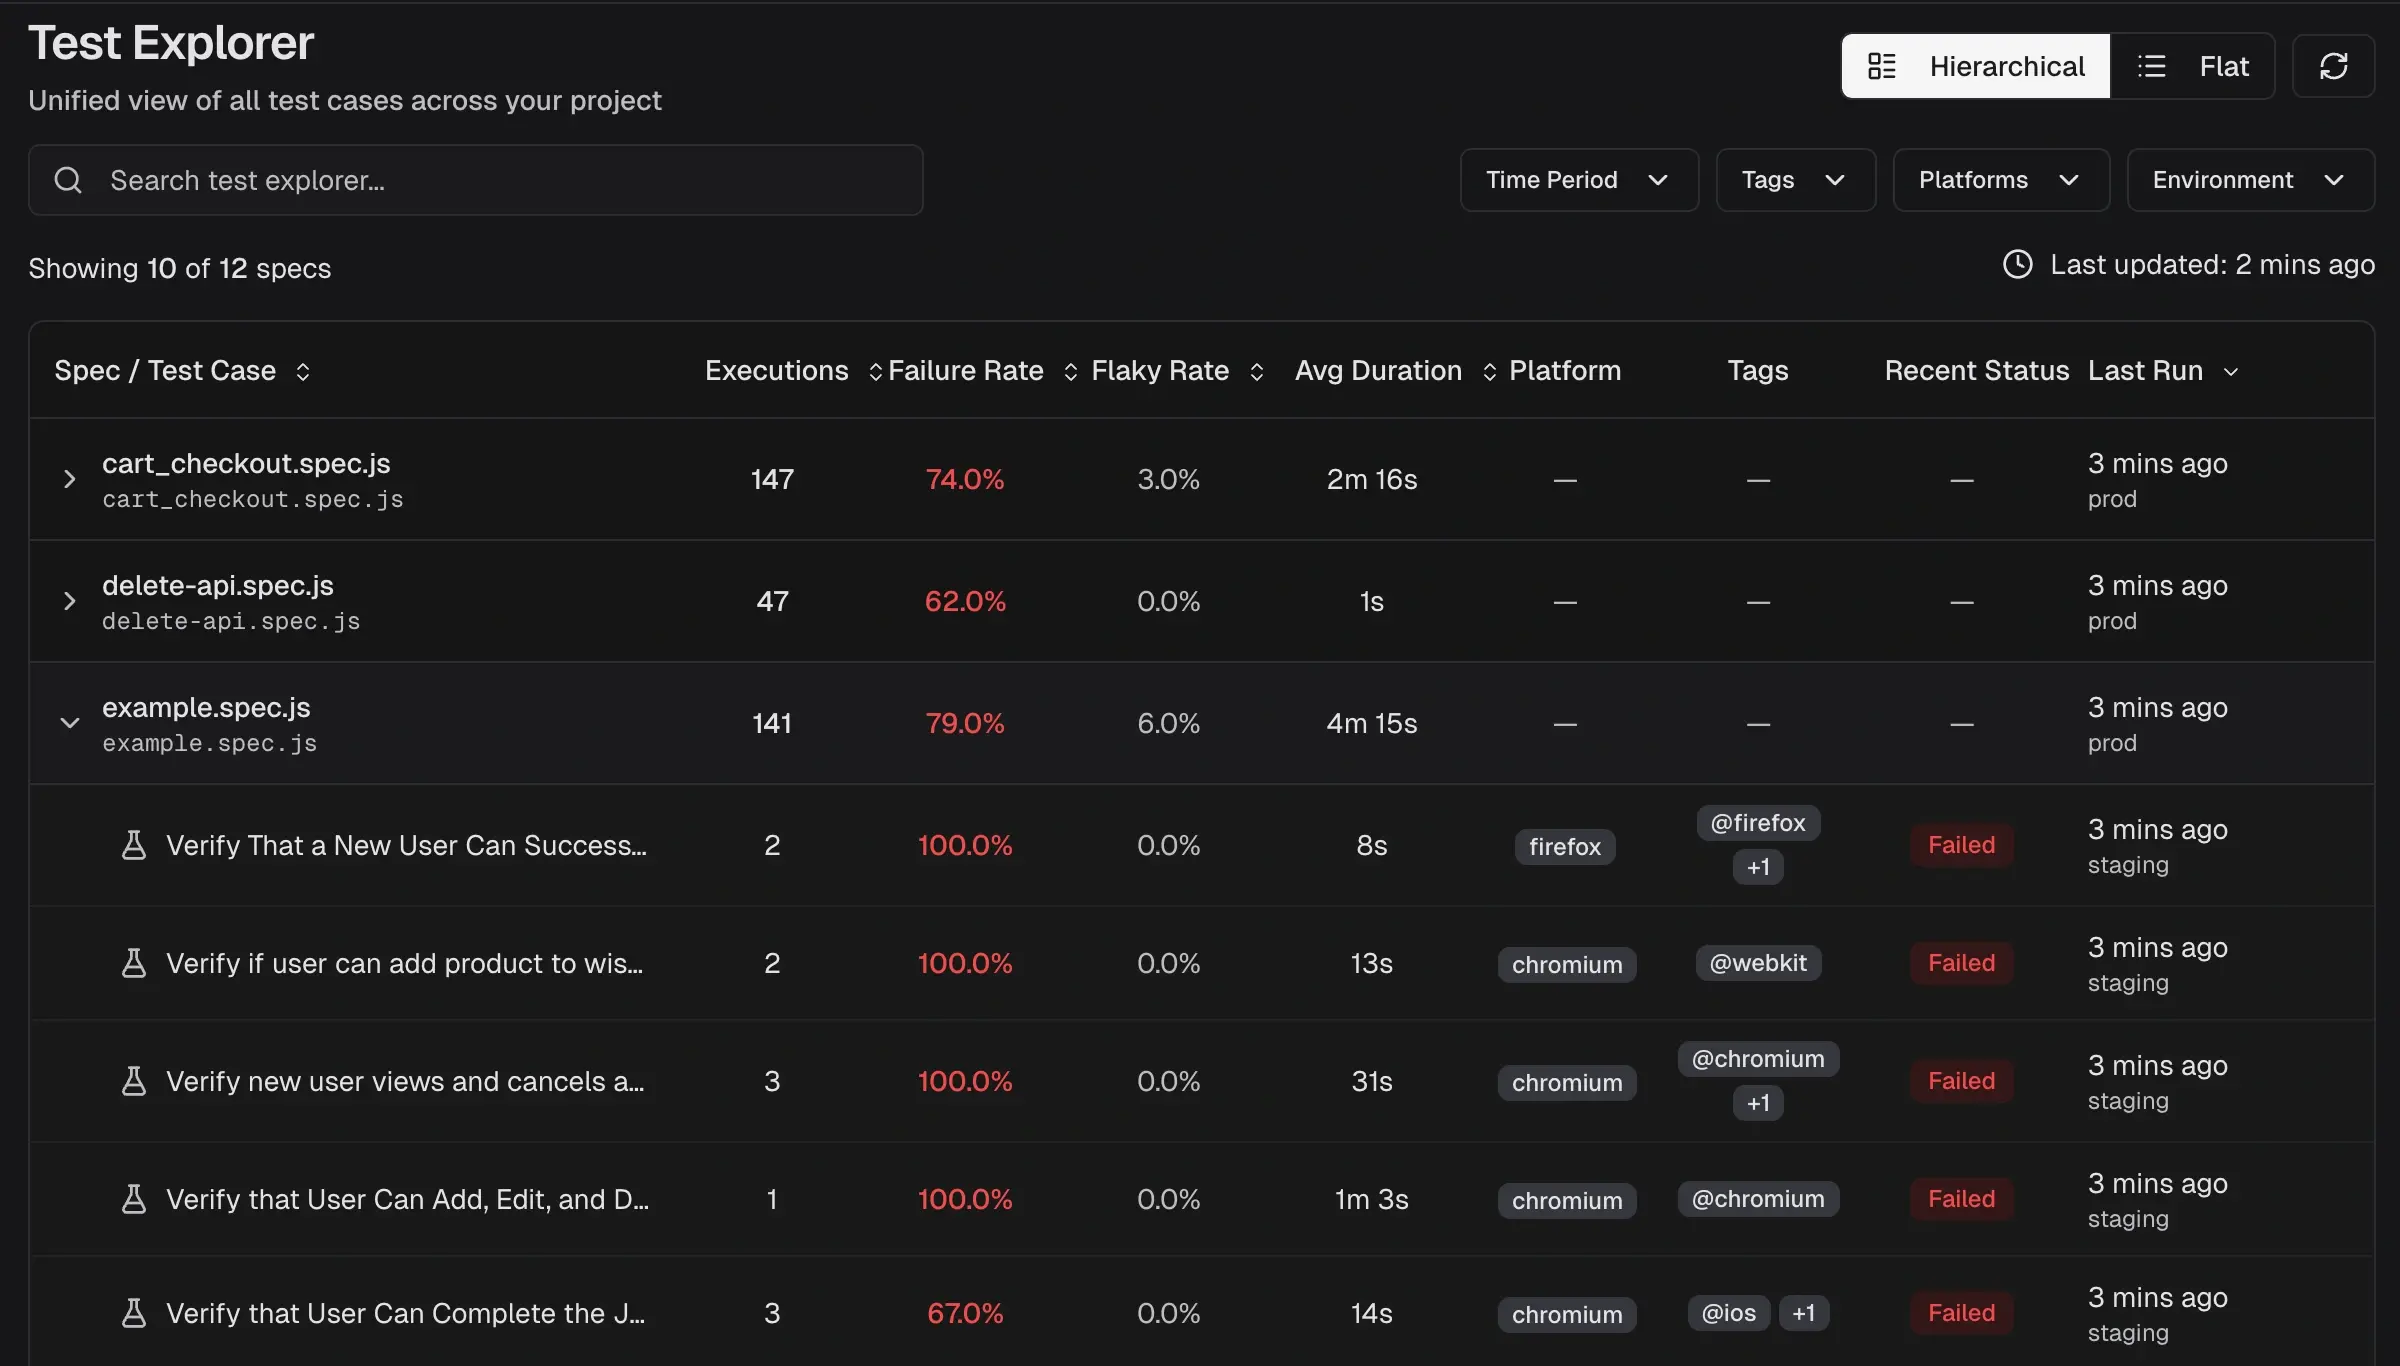 Use this view to identify problematic spec files at a glance, then drill into specific tests.
Flat View
Lists all individual test cases in a single table with per-test metrics. Each row shows the test title, its parent spec file, and execution data.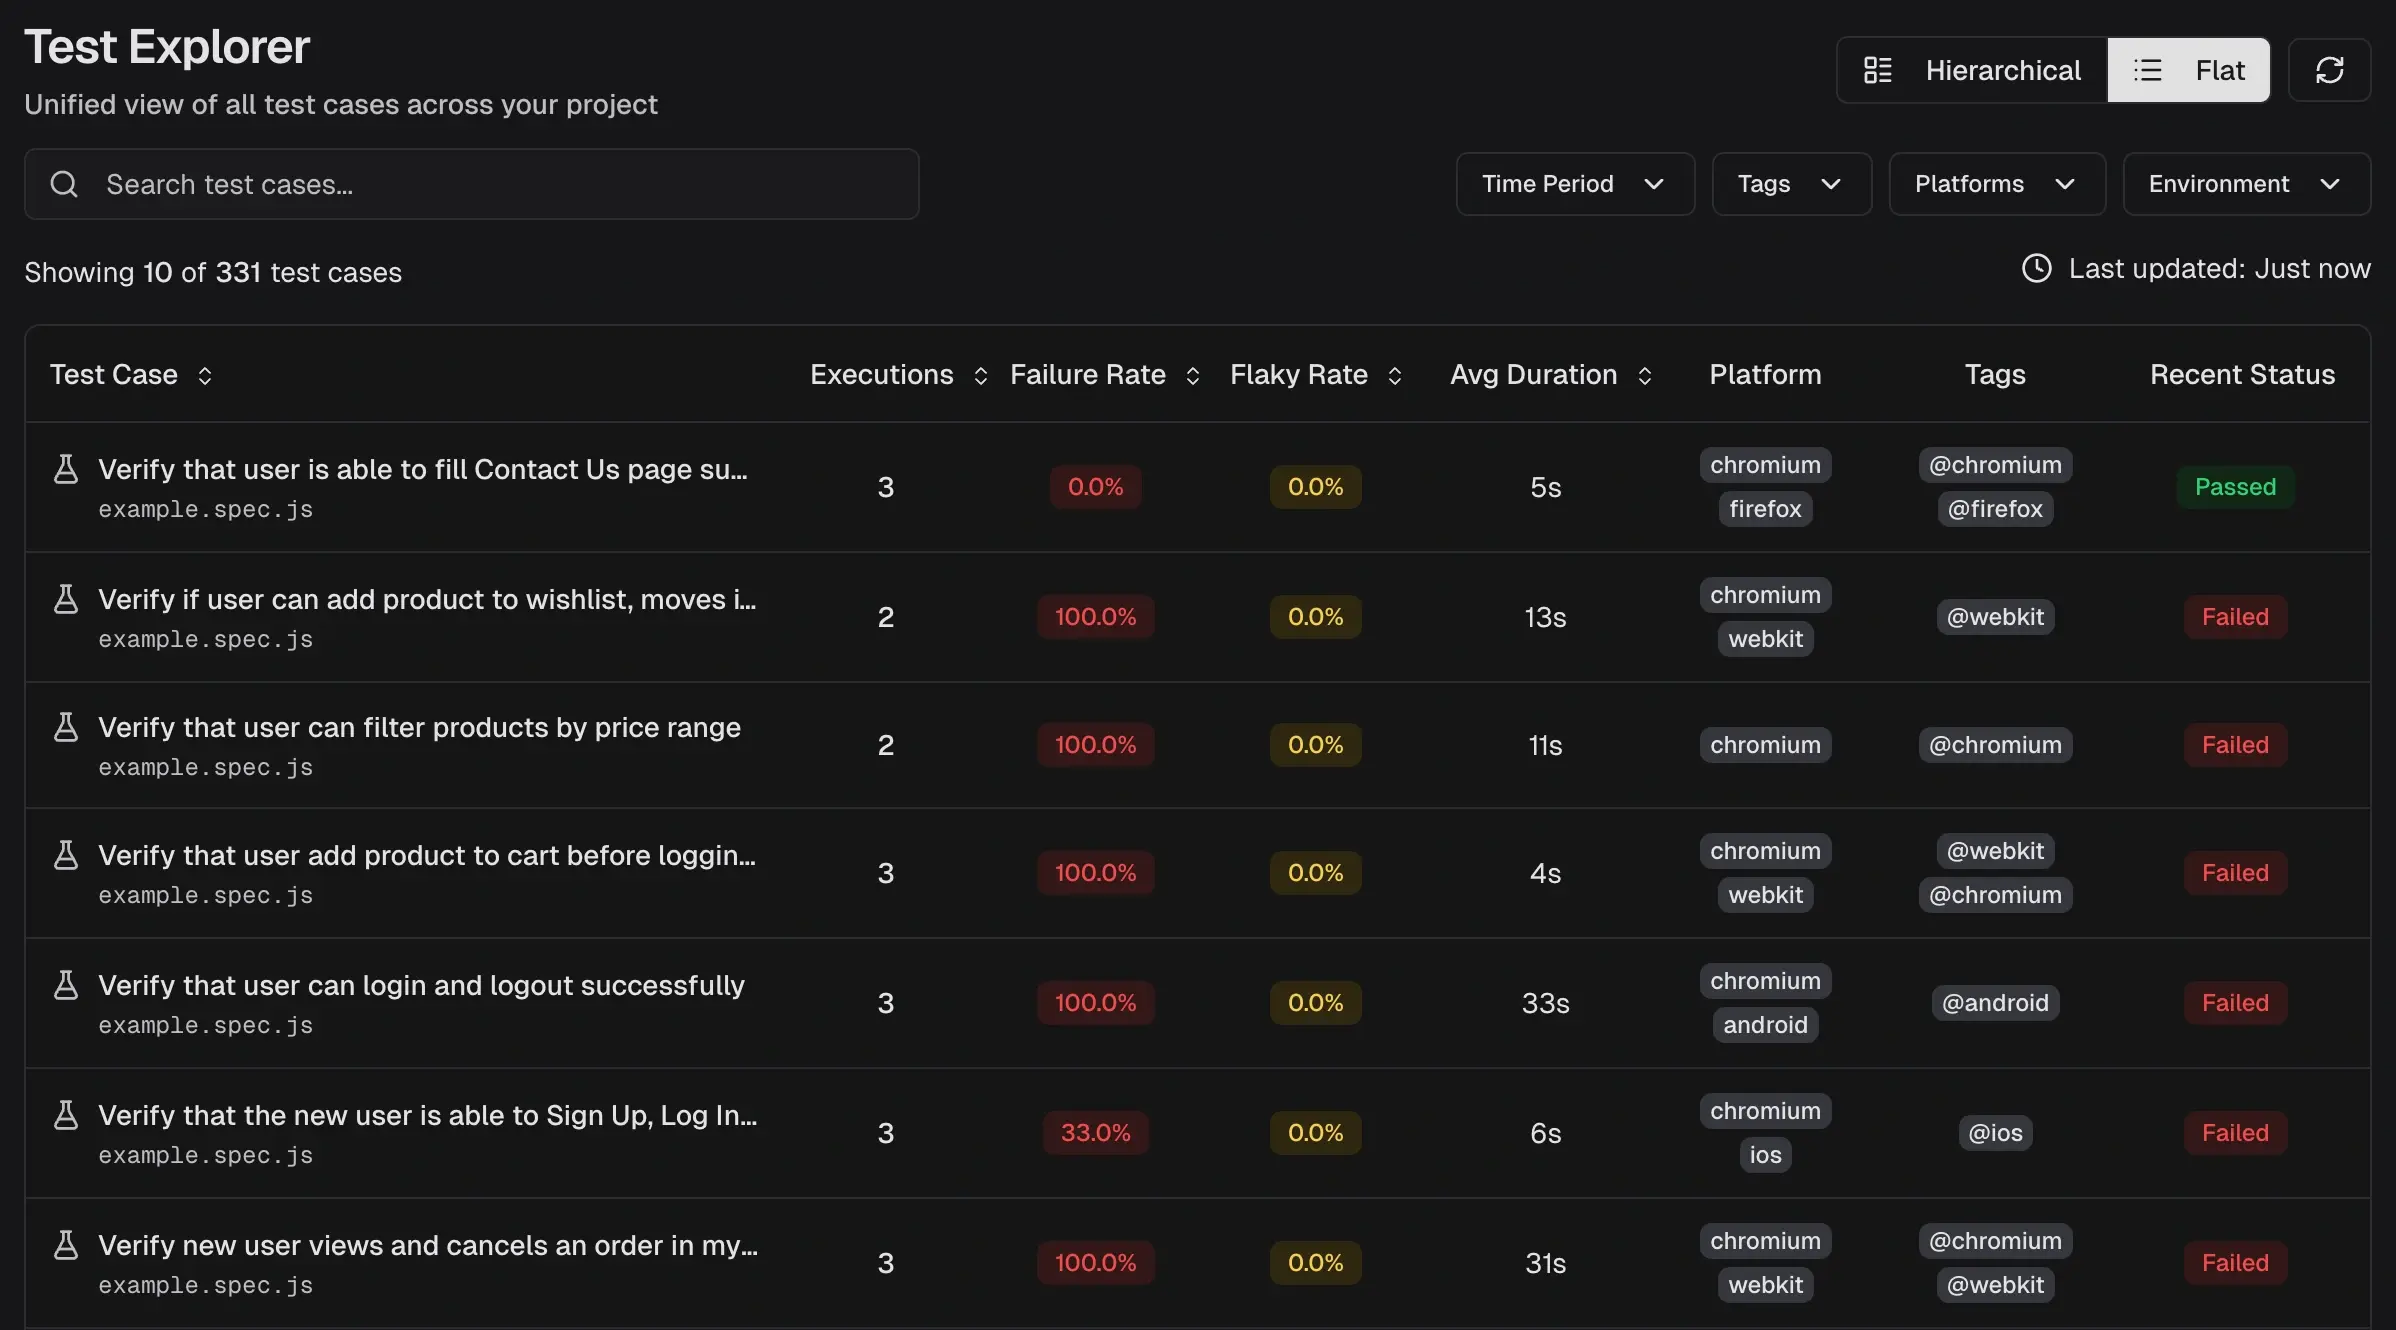 Use this view when searching for a specific test case or comparing metrics across tests from different spec files.
Columns
All columns are sortable in both view modes.| Column | Description |
|---|---|
| Spec / Test Case | File name (hierarchical) or test title with parent spec (flat) |
| Executions | Total runs within the selected time period and filters |
| Failure Rate | Percent of executions with at least one failure |
| Flaky Rate | Percent of executions with at least one flaky result |
| Avg Duration | Average execution time across all runs |
| Platform | Browser or platform used (e.g., chromium, firefox, ios) |
| Tags | Tags associated with the test case |
| Recent Status | Status of the most recent execution (Passed, Failed, Flaky) |
| Last Run | Timestamp of the last execution and the branch it ran on |
Filters & Search
Search
Filter by spec file name or test case title using the search bar. Search supports regex for advanced pattern matching.Filters
| Filter | Description |
|---|---|
| Time Period | Scope data to Last 7, 14, 30, 60, or 90 days |
| Tags | Filter by test case tags. See Test Run Analytics for tag health trends |
| Platforms | Filter by browser or platform (e.g., chromium, firefox) |
| Environment | Filter by target environment (e.g., staging, production) |
Sync
Click the sync button (top-right) to refresh data without reloading the page.Detail Drawer
Click any test case row to open the details drawer. The drawer contains two tabs.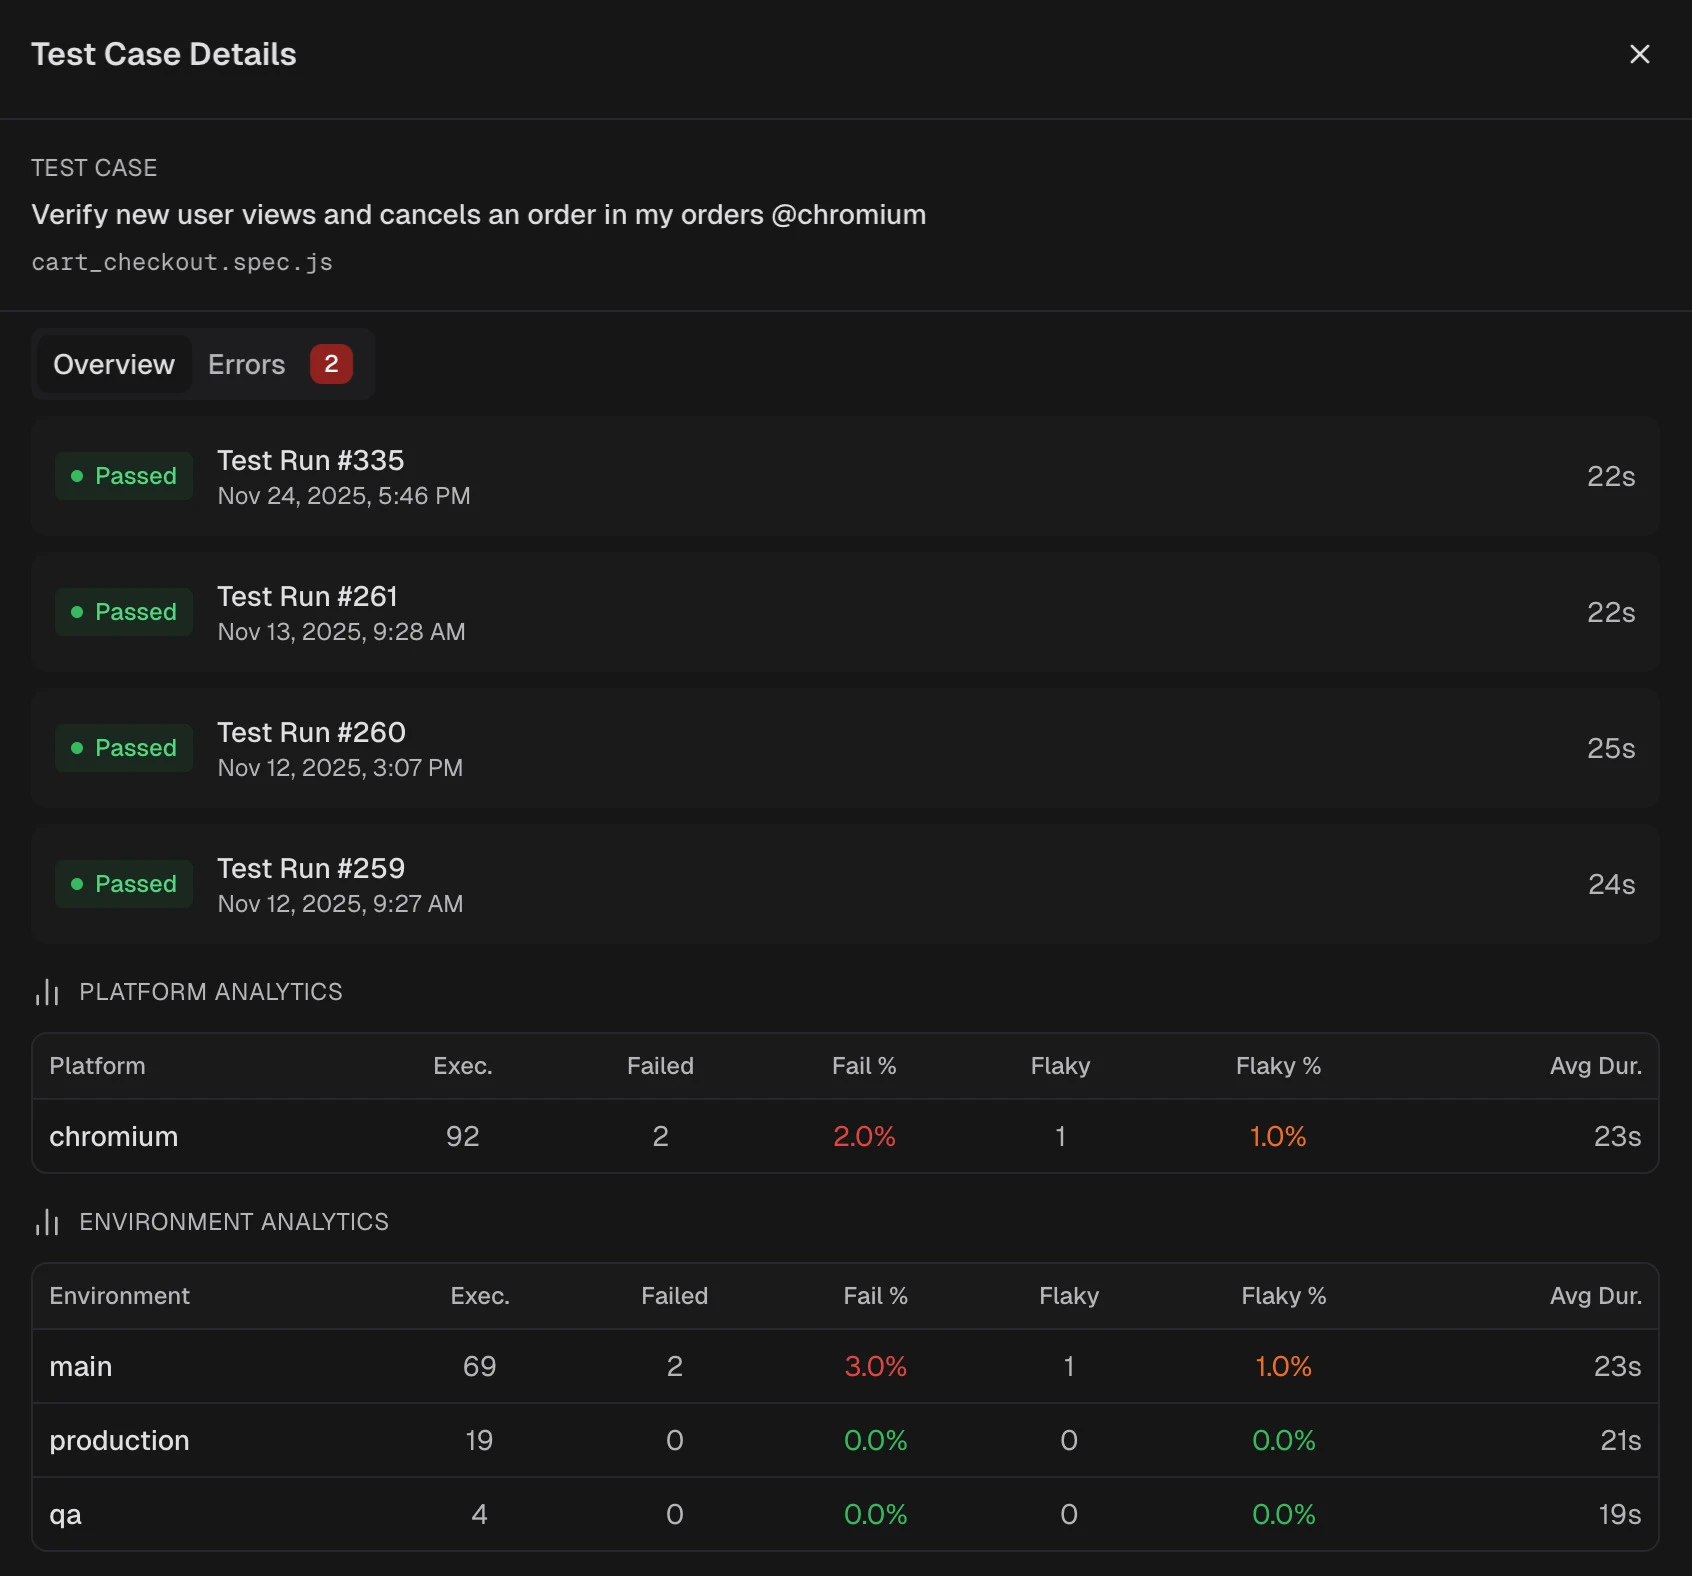
Overview Tab
- Test Run History displays the most recent executions with status, timestamp, and duration. Click a run to open the full test run details page.
- Platform Analytics breaks down executions, failures, flaky count, and average duration by browser or platform.
- Environment Analytics shows the same breakdown by environment (e.g., production, staging).
Errors Tab
Displays unique error messages aggregated across all executions of the test case. Each error entry shows:| Field | Description |
|---|---|
| First seen | Timestamp of the earliest occurrence |
| Last seen | Timestamp of the most recent occurrence |
| Count | Total number of times the error occurred |
| Error message | Full error text with stack trace context |
Get Started
- Set scope. Use Time Period and Environment filters to narrow the dataset.
- Identify targets. Sort by Failure Rate or Flaky Rate to surface unstable tests. Sort by Avg Duration to find slow tests.
- Switch views. Use Hierarchical view to find problematic spec files, then Flat view to compare individual tests across files.
- Inspect details. Click a test case to view execution history, platform breakdowns, and error patterns.
Pagination
Large datasets load in pages. Click Load More Specs (hierarchical) or Load More Test Cases (flat) at the bottom of the table to fetch the next batch.Related
Test Runs
View all test executions
Test Cases
Manage and organize test cases
Analytics
Project-wide test analytics
Flaky Tests
Detect and fix flaky tests