What you’ll learn
- How to assess PR health from KPI tiles and test trends
- What the latest test run card reveals
- How to use AI-generated insights for root cause analysis
PR Header
The header displays the primary context for the PR:- PR Title and Number: Name and unique identifier
- Status Badge: Current state (Open, Draft, Merged, Closed)
- View PR Link: Direct link to the PR in GitHub or merge request in GitLab
- Branch Information: Source and target branches
- Timestamp: Time of last update or creation
Sidebar
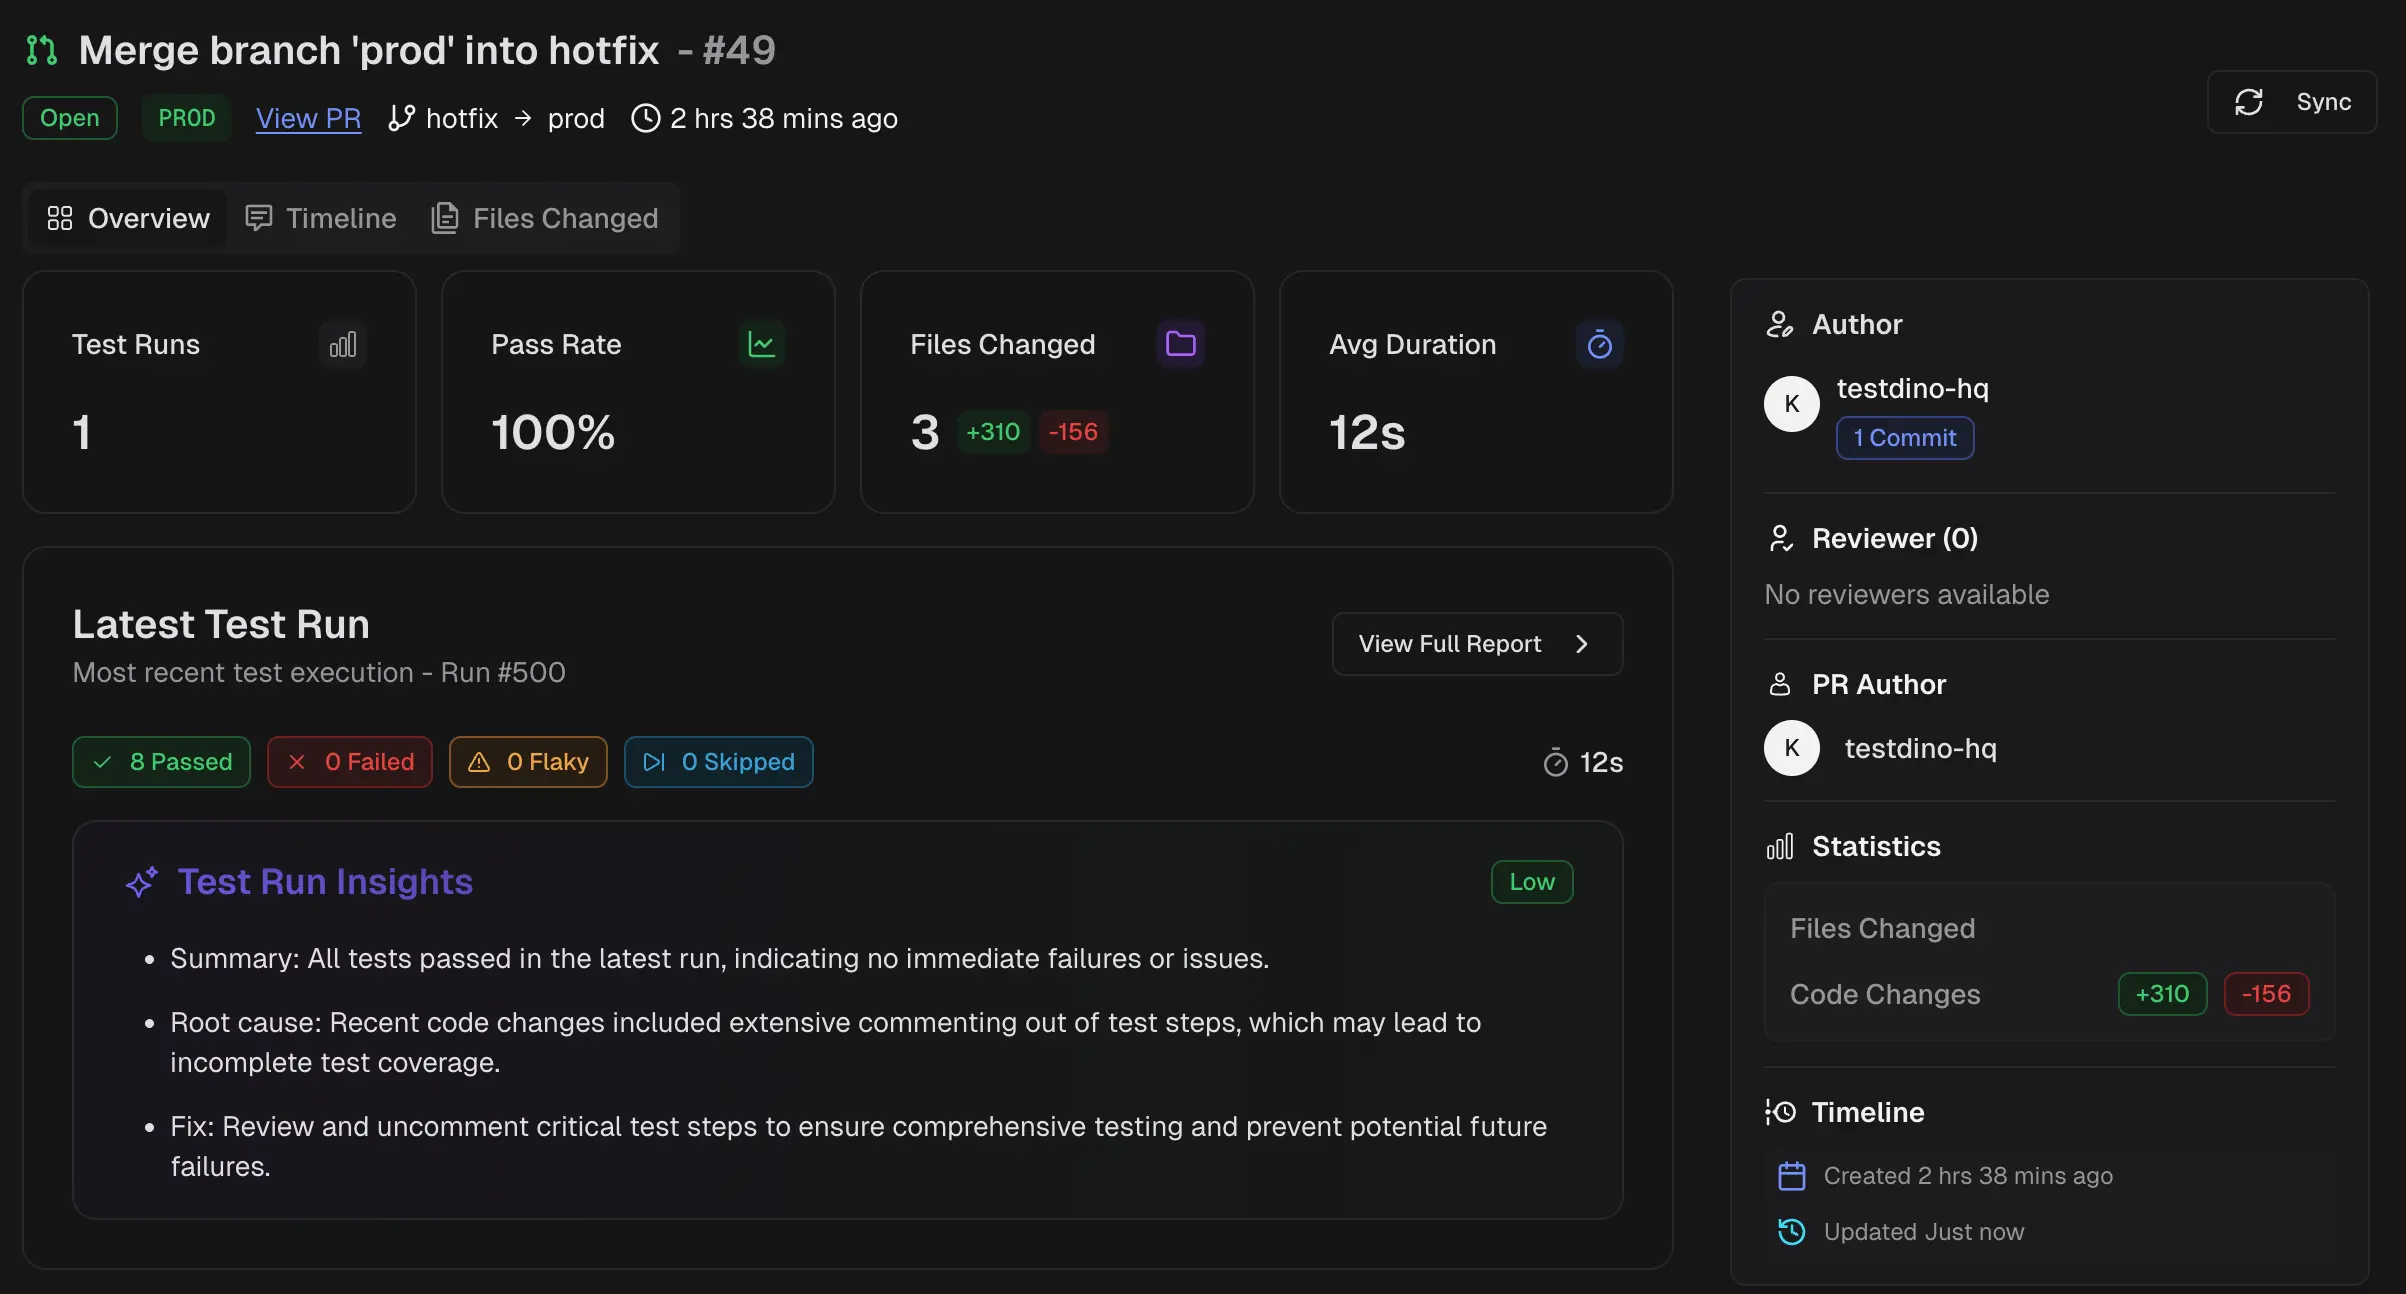 A panel displaying PR metadata and activity:
- Author, reviewer(s), and assignees
- Total files changed
- Aggregate code changes (additions and deletions)
- Created and last updated timestamps
KPI Tiles
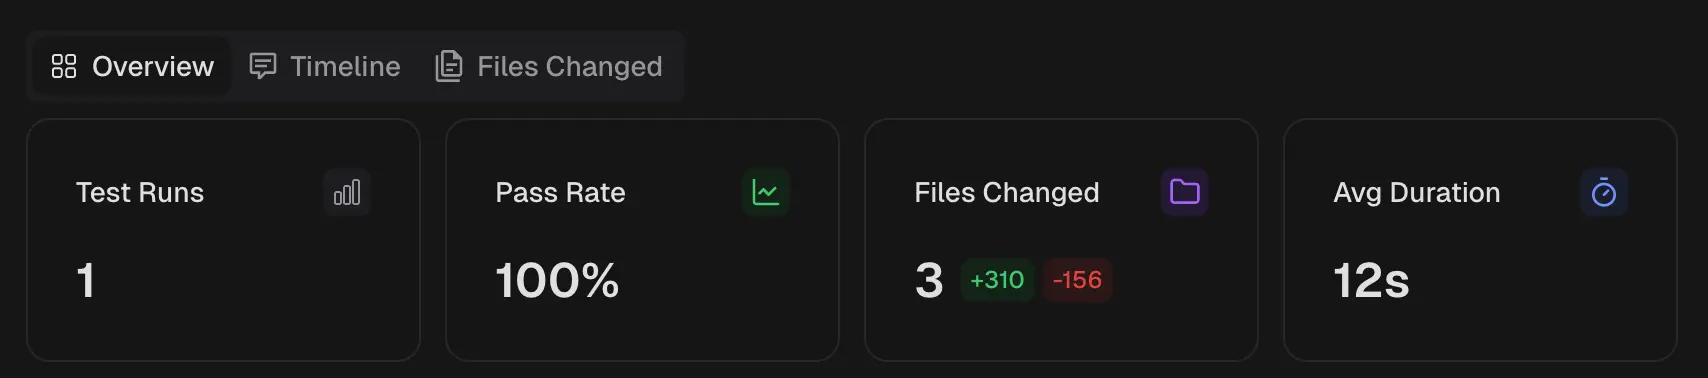 Four metrics summarizing PR activity:
| Tile | Description |
|---|---|
| Test Runs | Total number of test runs executed for this PR |
| Pass Rate | Aggregate pass rate across all test runs |
| Files Changed | Total lines added and deleted |
| Average Duration | Average execution time per test run |
Latest Test Run
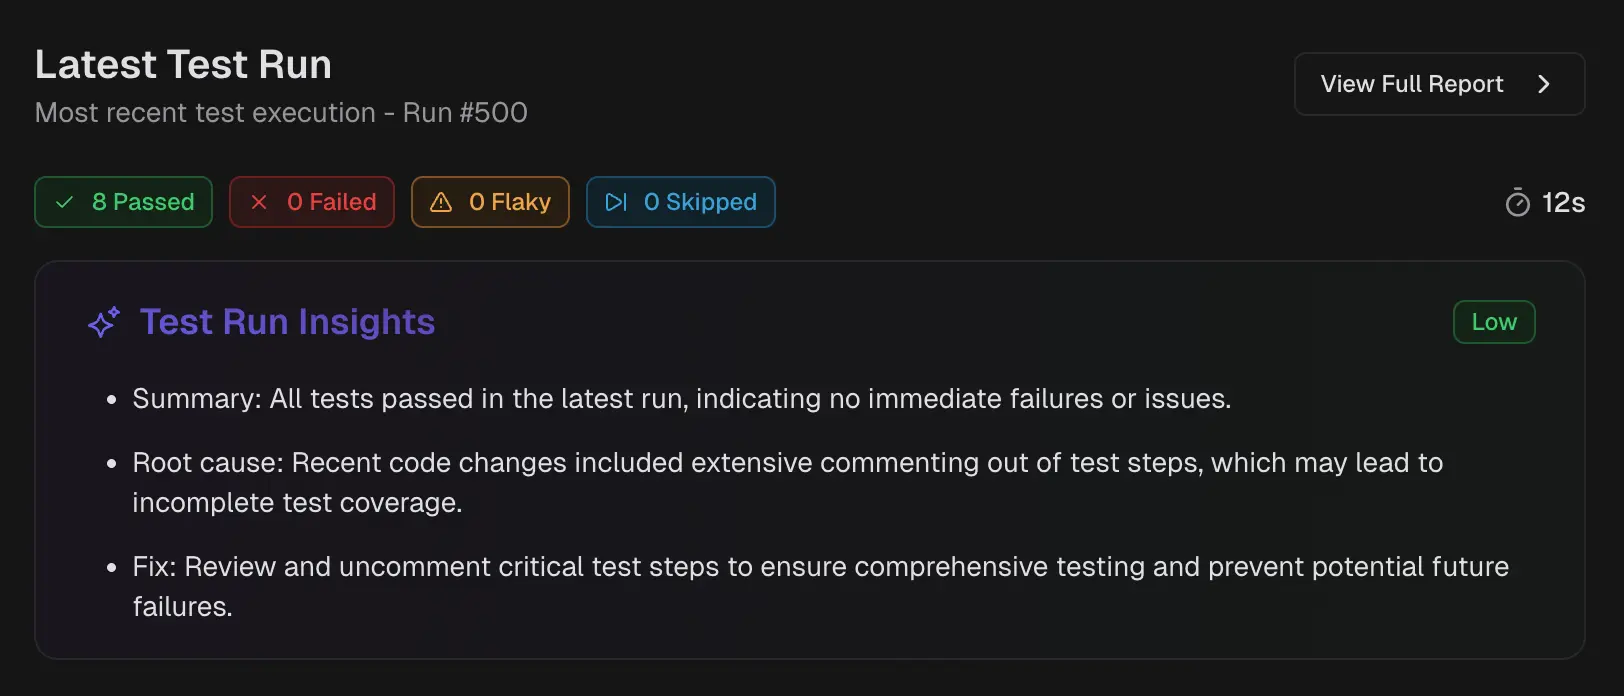 This card shows results from the most recent test execution:
- Status Counts: Passed, failed, flaky, and skipped tests for this run
- Duration: Execution time for this specific run
Test Results Trend
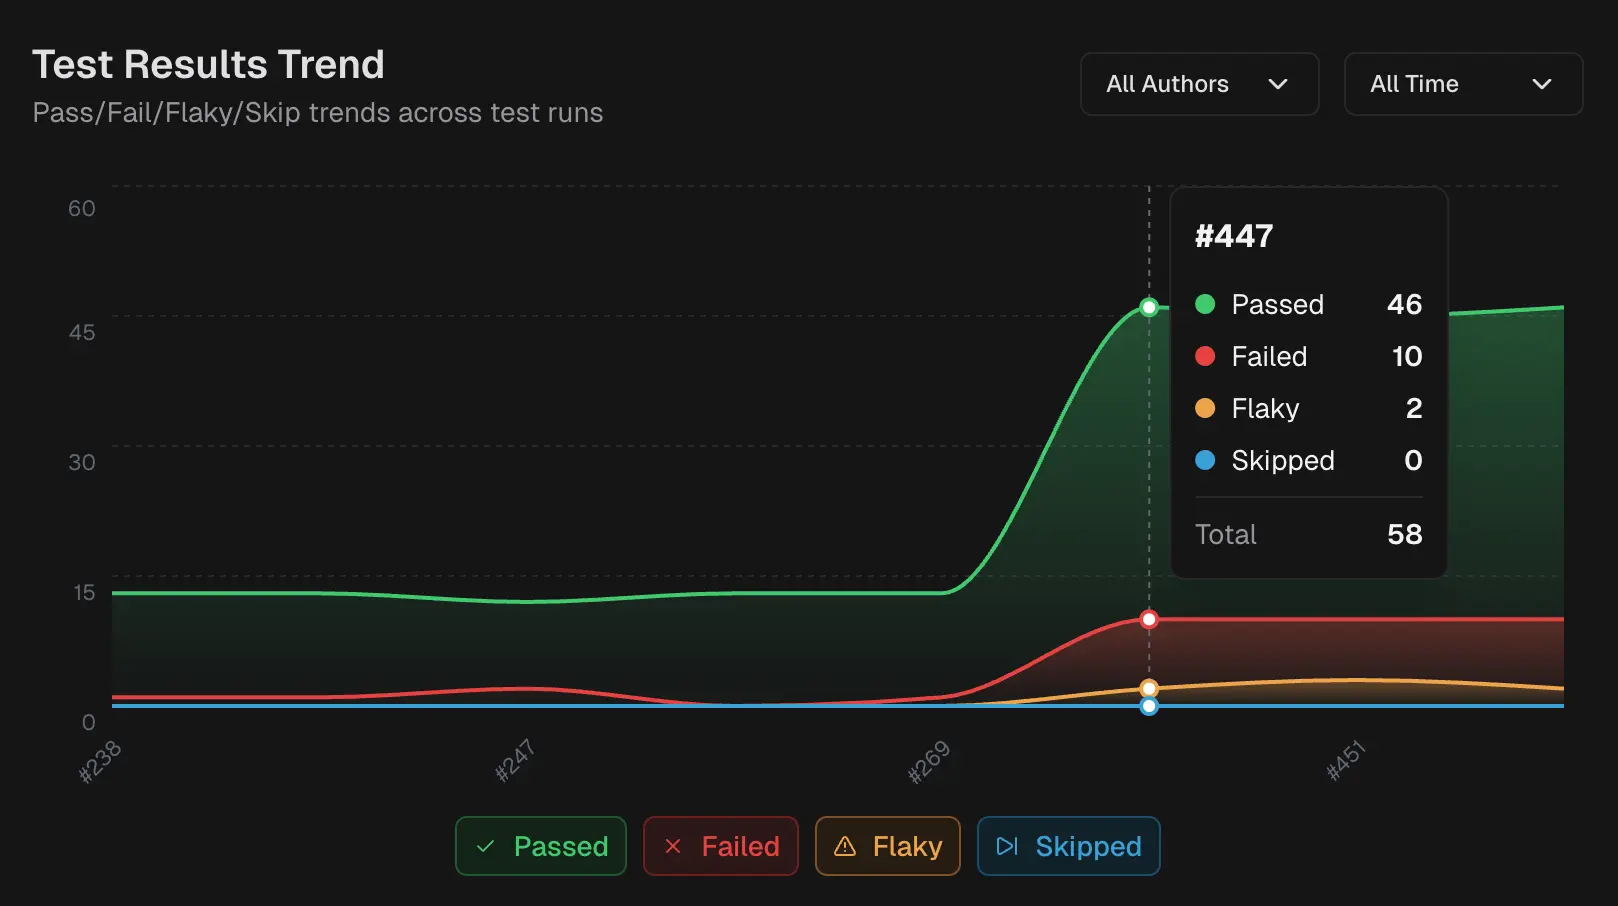 A graph showing test results across all runs for this PR:
- Trend Graph: Plots passed, failed, flaky, and skipped counts over time
- Interactive Tooltip: Hover over any point to see exact counts for that run
Related
Timeline
Chronological log of commits, test runs, and review activity
Files Changed
Review code diffs and modifications inside TestDino
Test Runs
View detailed test run results and analysis