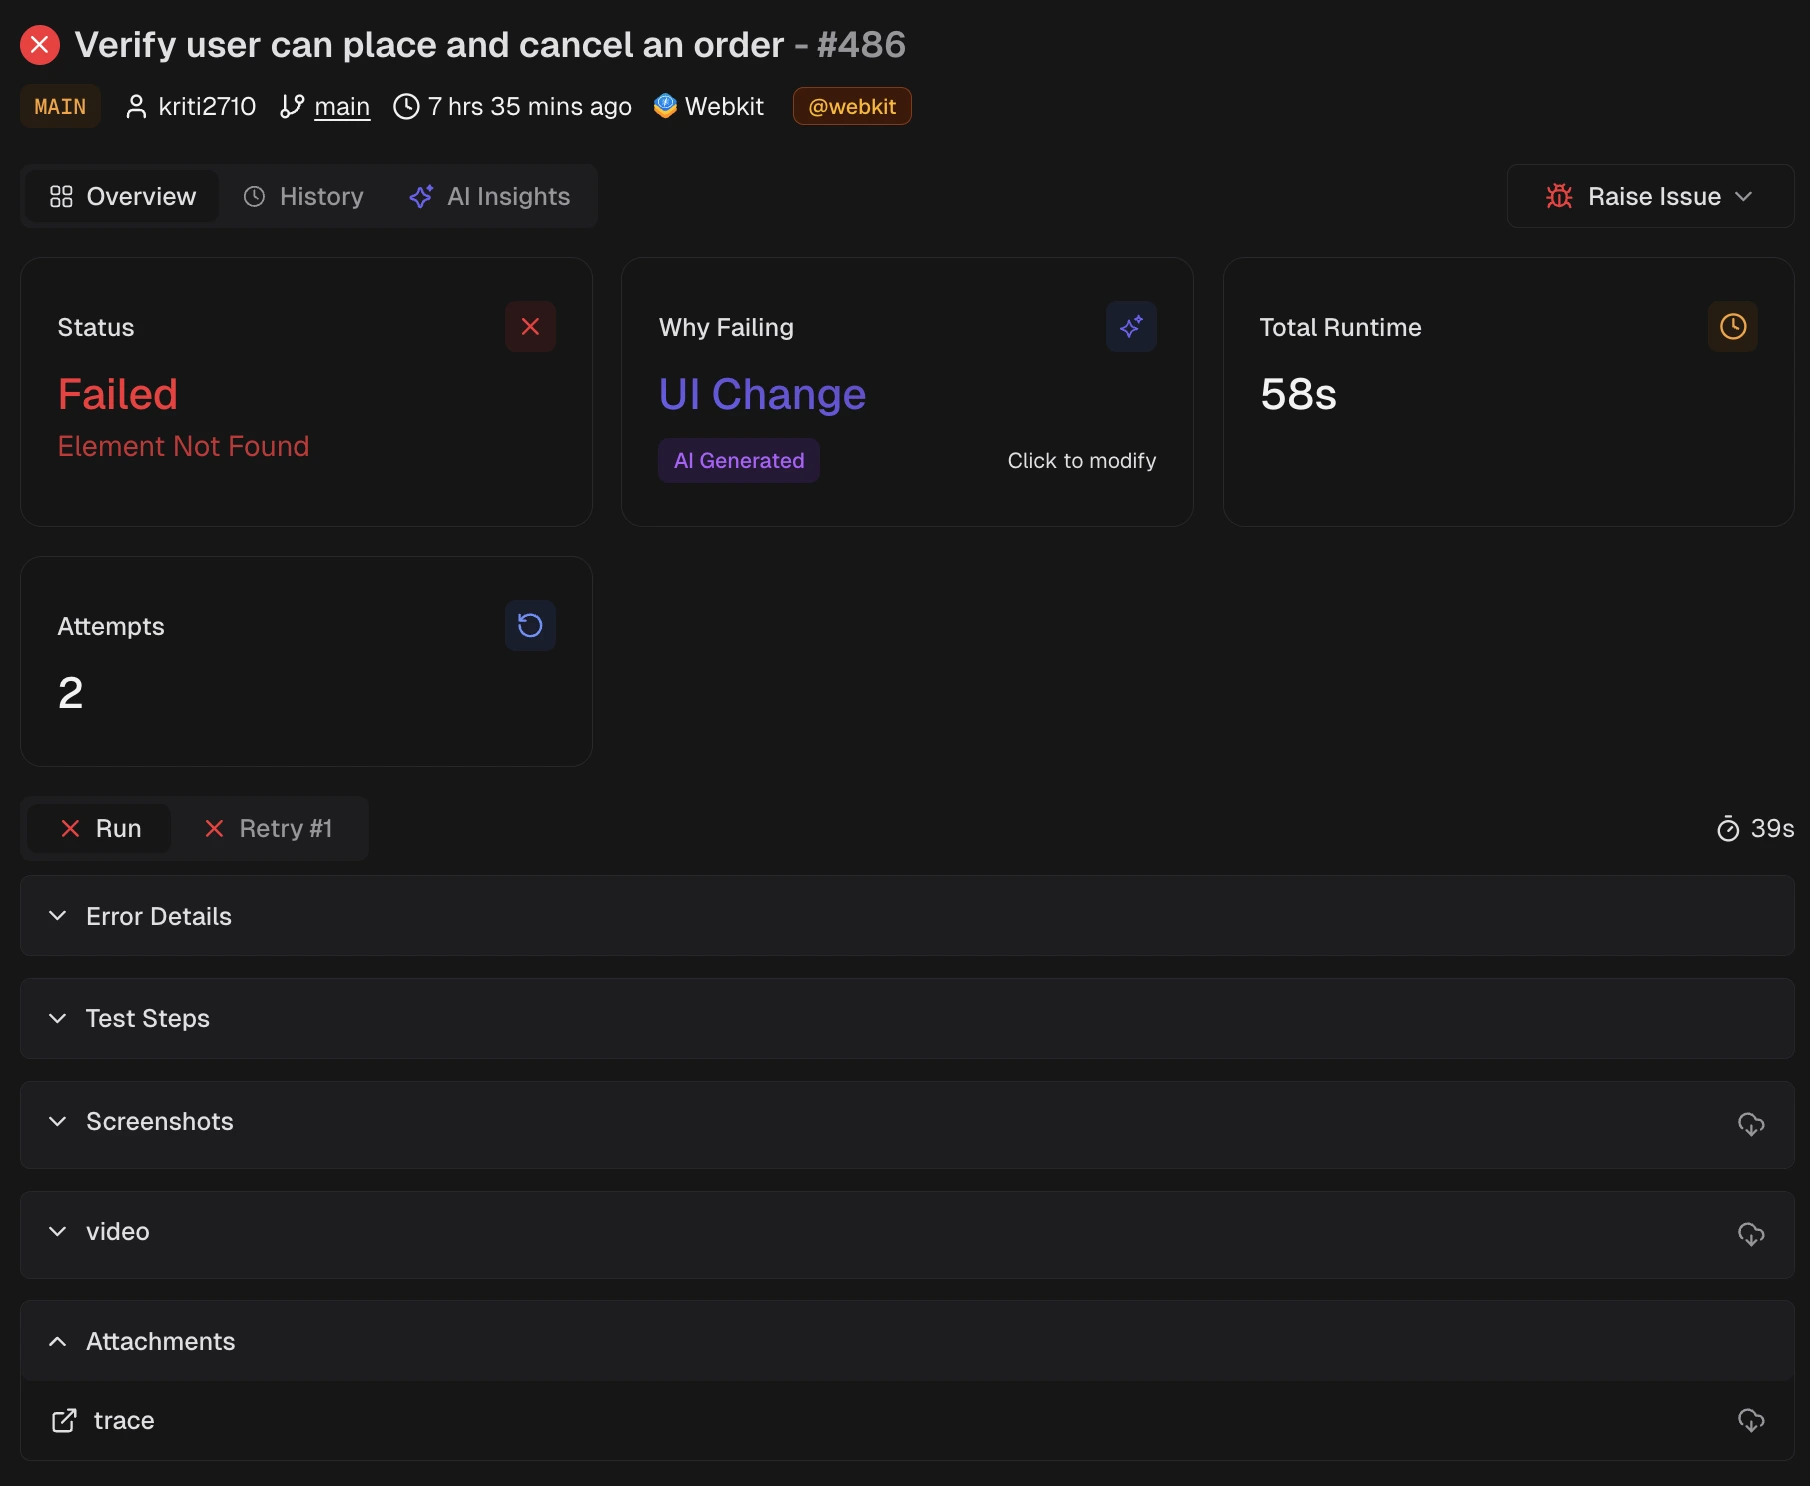
KPI Tiles

1. Status
Outcome for this run: Passed, Failed, Skipped, or Flaky. For failed or flaky tests, the primary technical cause is shown.2. Why Failing
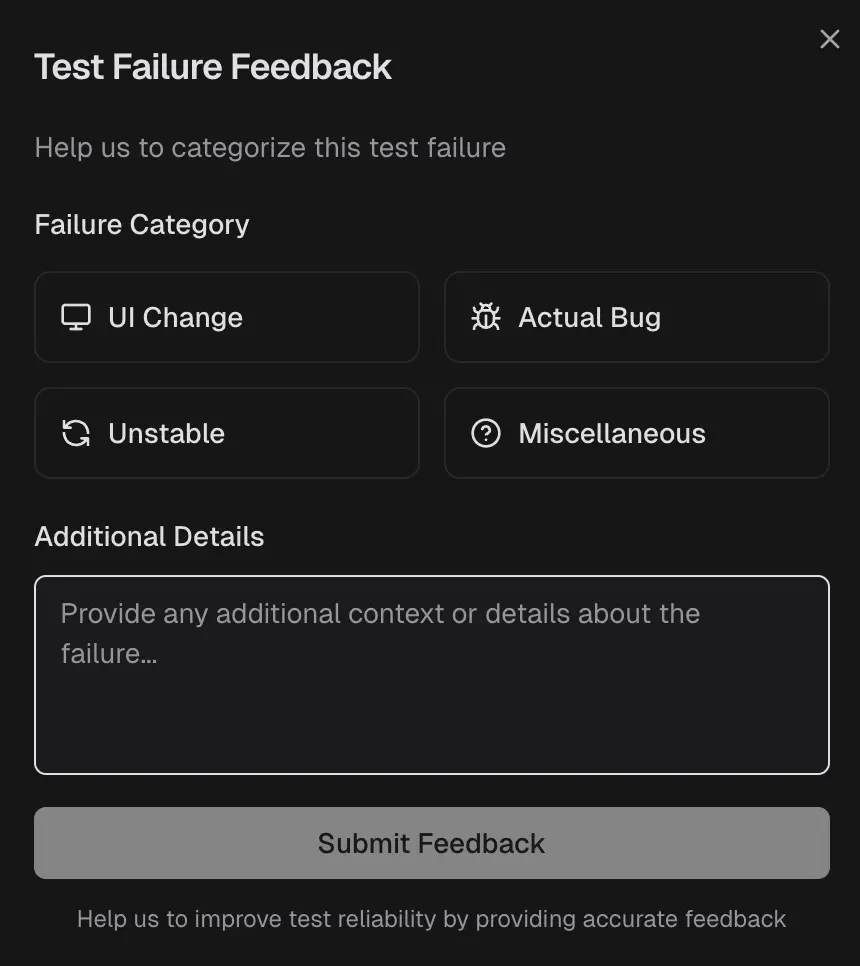
AI category for the failure: Actual Bug, UI Change, Unstable, or Miscellaneous. Includes a confidence score. Use this to decide whether to fix the product code, update the test expectations, or stabilize the test.Feedback on classificationFor failed or flaky tests, use Test Failure Feedback to set the correct category and add context. This updates the current run and improves future classification.

3. Total Runtime
Total execution time for this test in the current run. Useful for spotting slowdowns after code or configuration changes.4. Attempts
Number of retries executed by your retry settings. A pass after a retry often signals instability that needs cleanup.Annotations
If your Playwright test includestestdino: annotations, they appear in the Annotations panel just below the KPI tiles. This panel displays all the metadata attached to the test: priority, feature area, ticket link, owner, Slack notification targets, context notes, and flaky reason.
These annotations come from your test code and are read-only in the UI. To add or change them, update the annotation array in your test file. See the Annotations guide for setup instructions and all supported types.
Evidence
 Evidence is grouped by attempt, for example,
 run, retry 1, retry 2.
1. Error Details
Exact error text and key line. Copy this into a ticket or use it to reproduce locally.2. Test Steps
Shows the step list with per-step timing. Use it to locate where the failure occurred.3. Screenshots
Screenshots captured during the attempt. Use them to confirm UI state at the time of failure. For a detailed guide, see Visual Evidence.4. Console
Shows browser console output. Use it to correlate script errors or warnings with the failure.5. Video
A recording of the attempt. Use it to confirm the sequence of actions and timing across retries. Know more about videos at Visual Evidence.6. Trace
Shows the Playwright trace for the attempt when available. Use it to inspect actions, network calls, console output, and DOM snapshots. See more details at Trace Viewer.Visible only when Playwright tracing is enabled, for example,
trace: 'on' or trace: 'on-first-retry'.7. Visual Comparison
Snapshot comparison for tests that use Playwright visual assertions, for example,toHaveScreenshot. See more details at Playwright Visual Testing.
Use the viewer to compare screenshots in these modes:
| Mode | What it shows | How it helps |
|---|---|---|
| Diff | Highlighted changed regions | Find small layout or visual shifts |
| Actual | Screenshot from the failing attempt | See what renders during the test |
| Expected | Stored baseline image | Decide whether the baseline must change |
| Side by side | Expected and actual in two panes | Compare quickly across elements |
| Slider | Interactive sweep between images | Inspect subtle differences |
- Visible only when the test suite generated visual comparisons.
- If no snapshot artifacts exist, the Image Mismatch panel is hidden.