- QA Engineers can quickly spot whether a single error is responsible for most failures or if you’re dealing with multiple unrelated problems.
- Developers can jump directly to the error message and stack trace without having to click through individual test cases one by one.
Layout
The page consists of three main sections: a search bar, status filters, and an error groups table.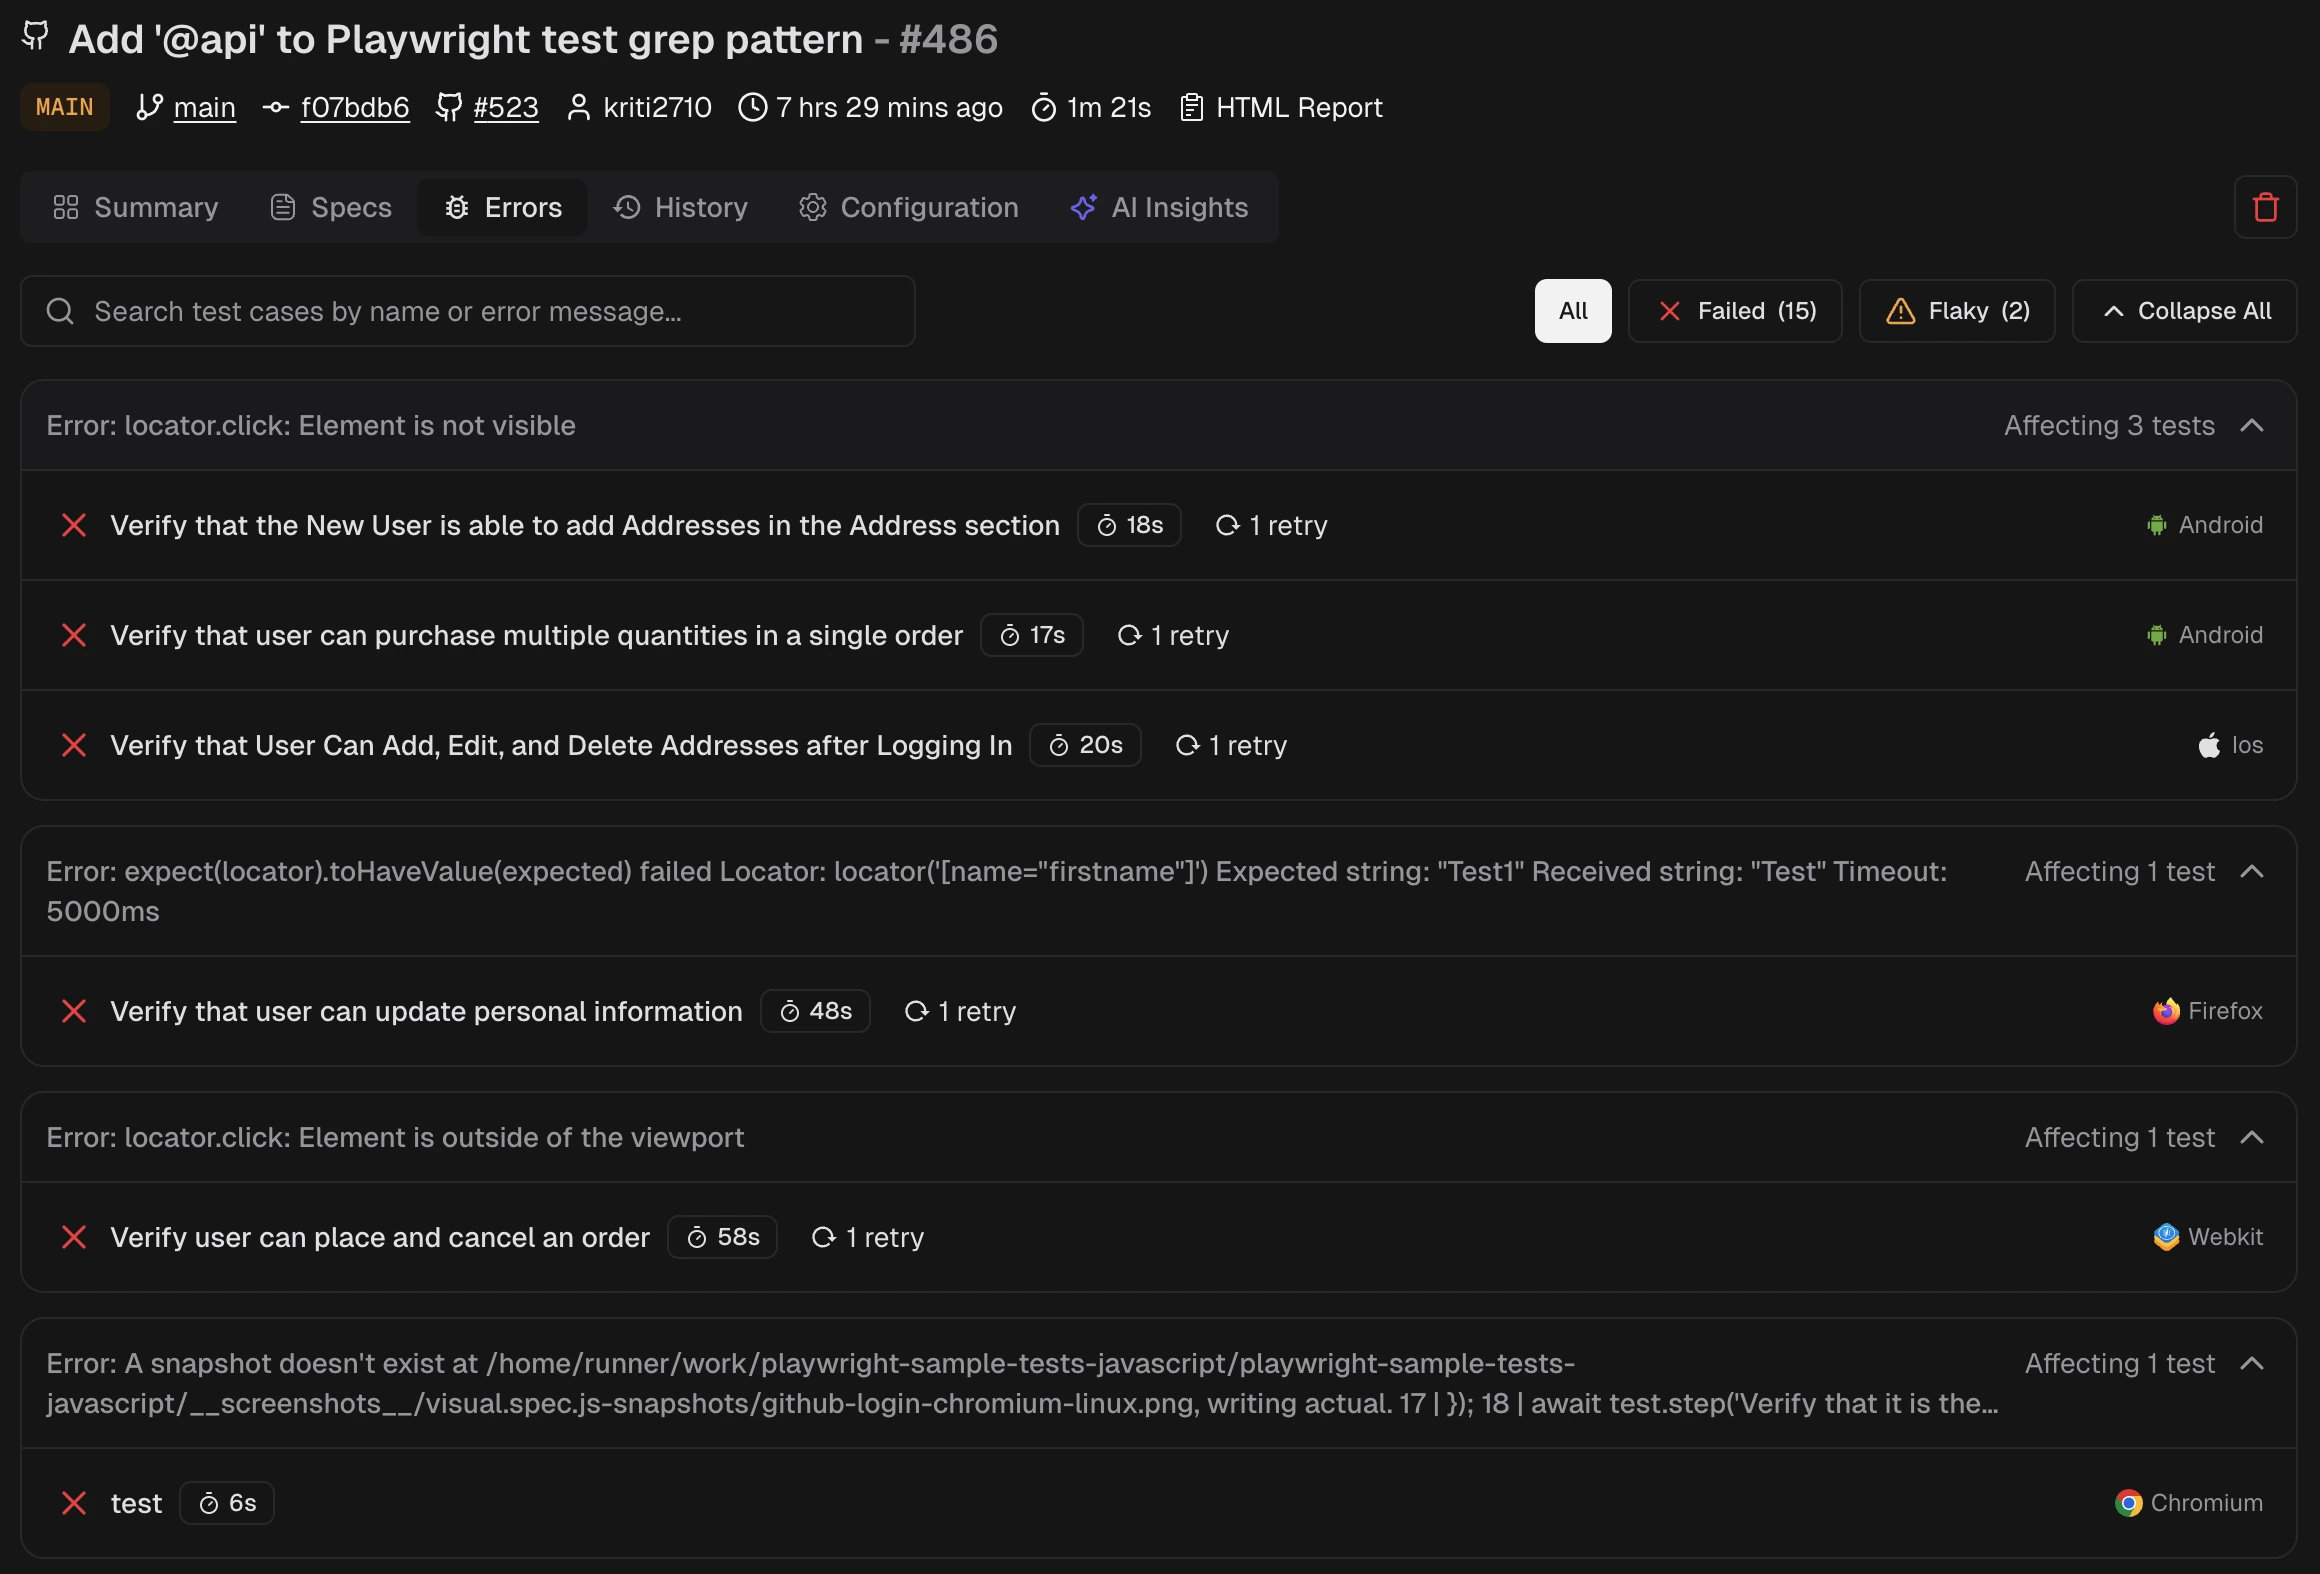
Search
Search by test name or error text. Results update as you type.Status Filters
Filter the grouped list by outcome: All: Shows all test cases in the run, grouped by error Failed: Only failed test cases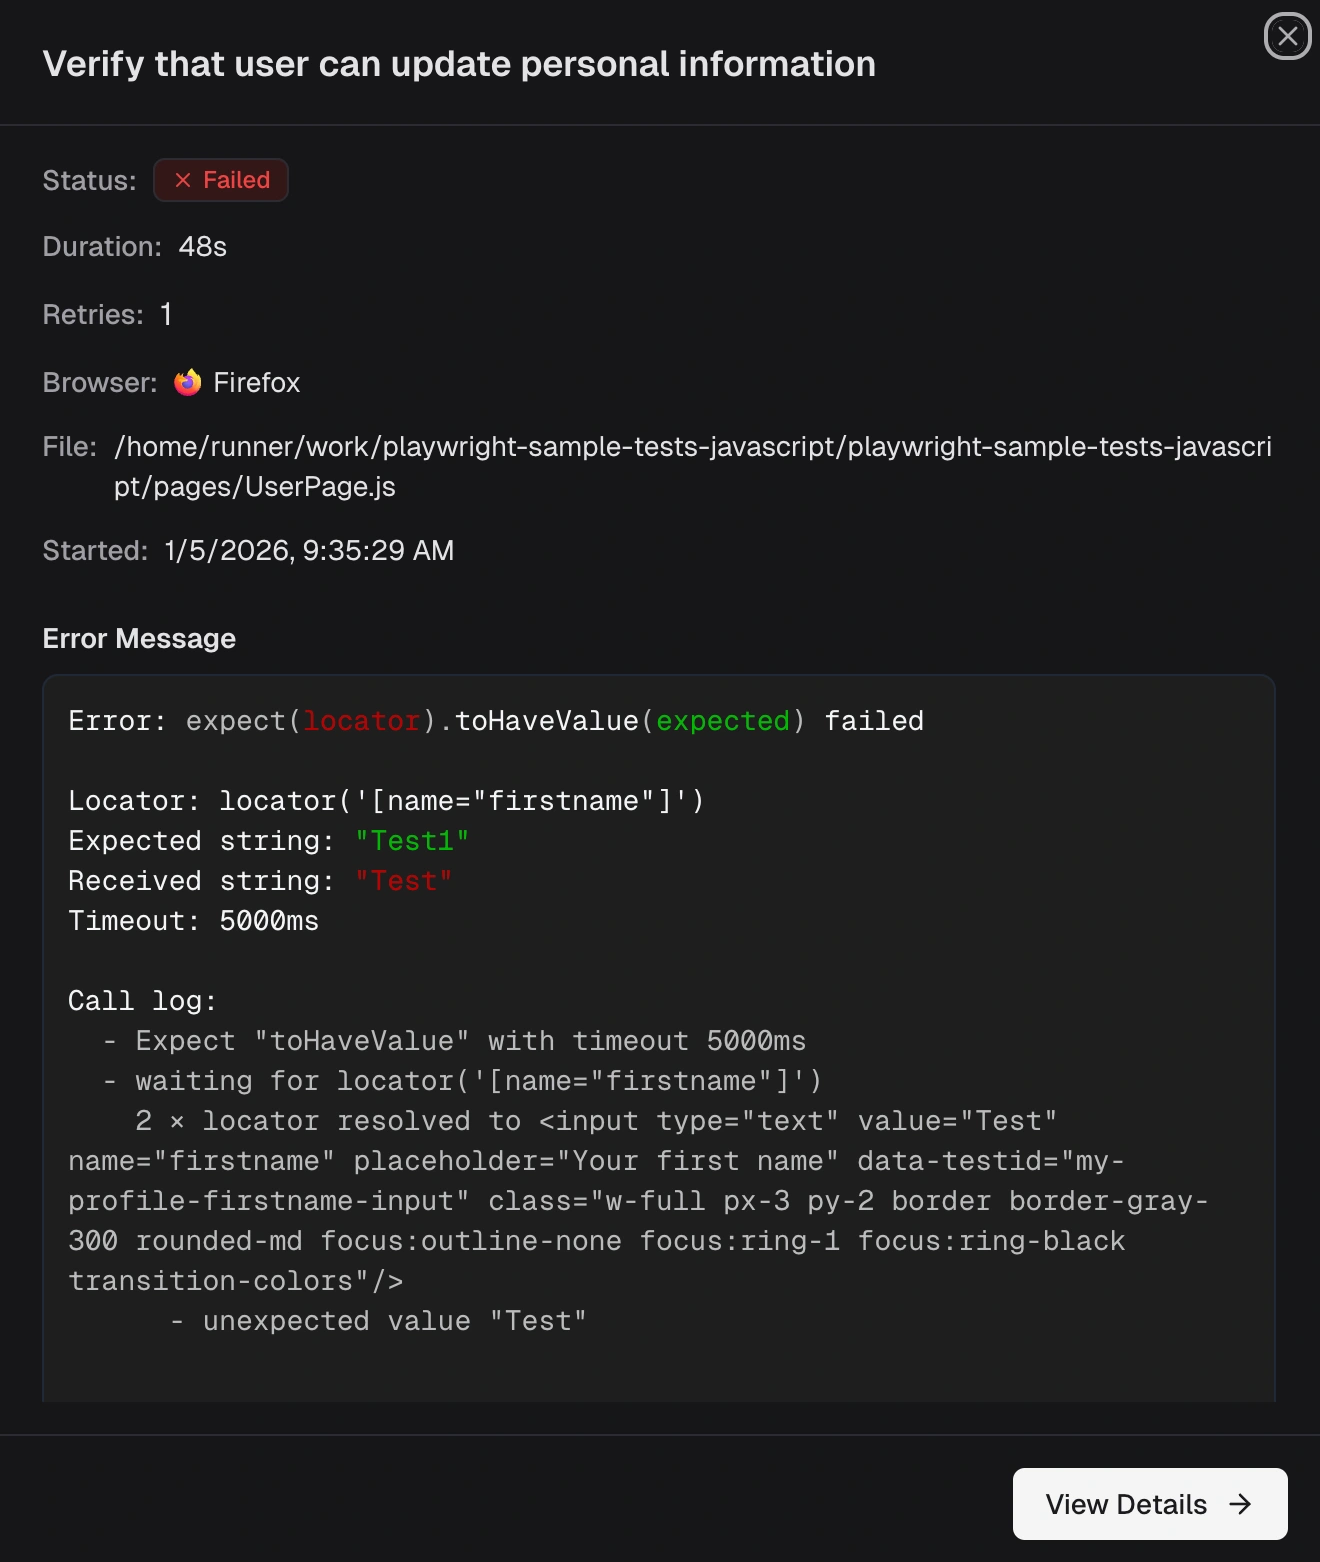 Flaky: Test cases that passed on retry but had at least one failure (See: common reasons).
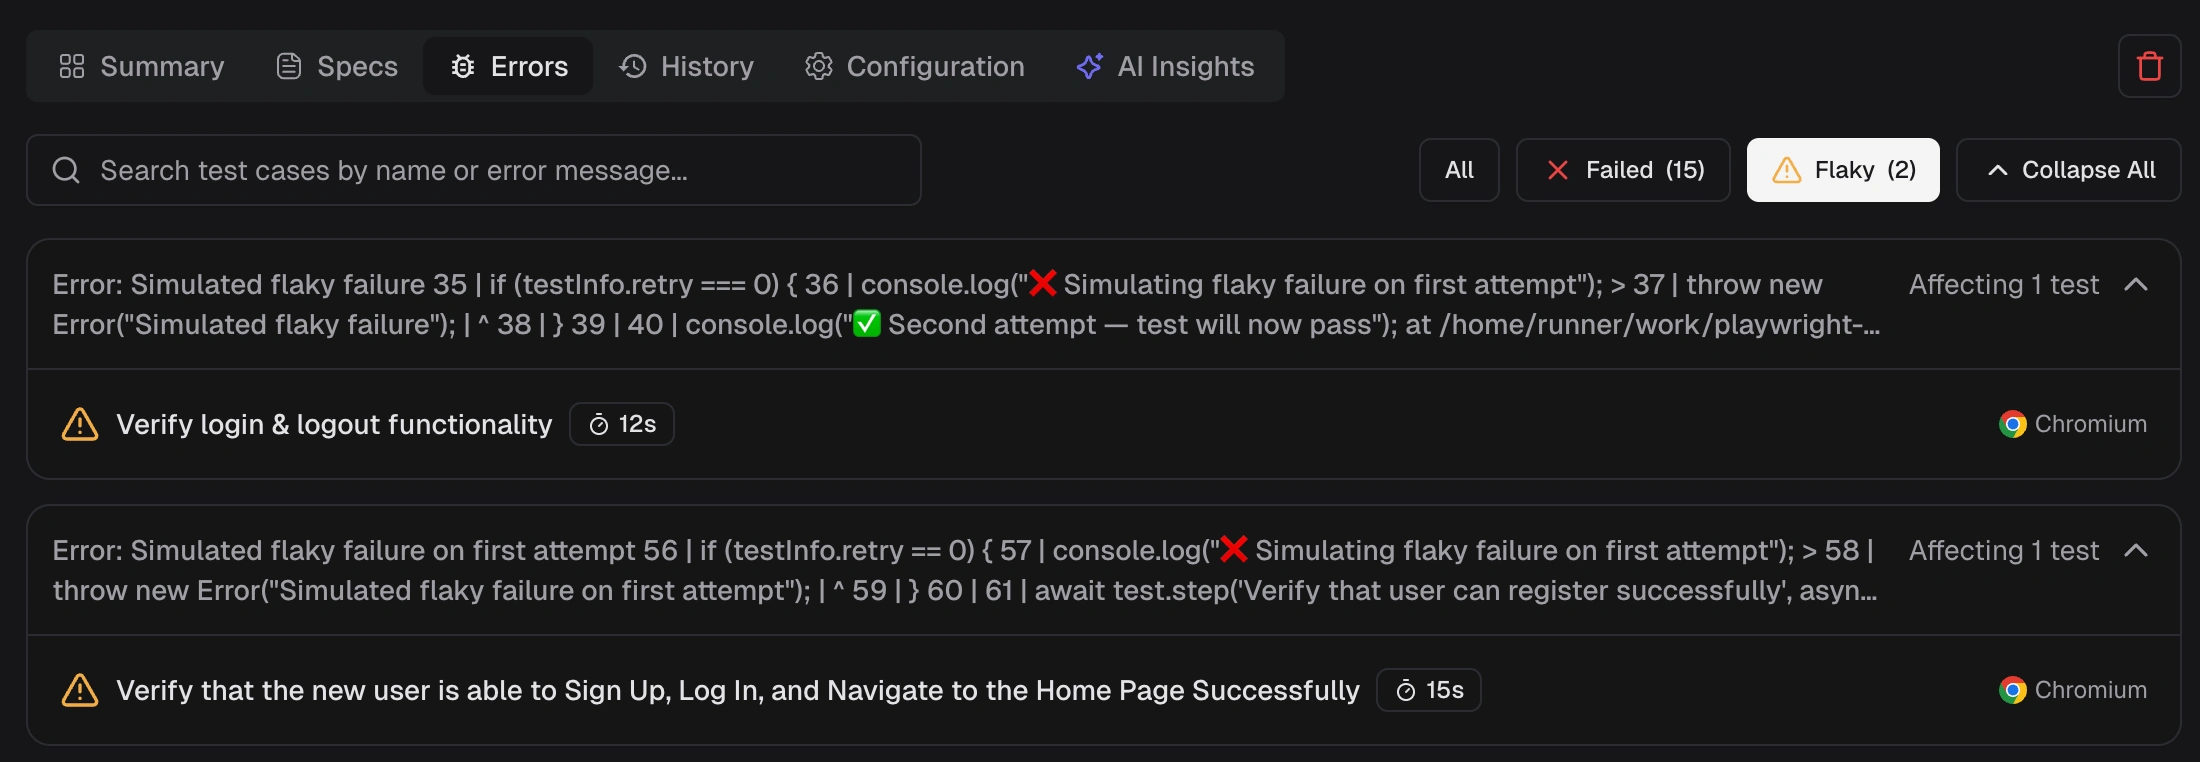 Each filter displays a count: See how many test cases fall into each category.
Expand / Collapse: Use the toggle on the right to expand all error groups at once or collapse them back to just the error headers.
Each filter displays a count: See how many test cases fall into each category.
Expand / Collapse: Use the toggle on the right to expand all error groups at once or collapse them back to just the error headers.
Error Groups
Each row in the table represents a unique error message. The row shows:- Error text
- Number of affected tests
Test Case Rows
Each test case row shows:- Status icon: A ❌ for failed, a ⚠️ for flaky.
- Test name: The full test case title.
- Browser: Which browser ran the test (Chromium, Firefox, Webkit, iOS, etc.).
- Duration: How long the test took.
- Retries: Number of retry attempts, if any.
Side Panel
The side panel displays details for one test case without leaving the Errors tab.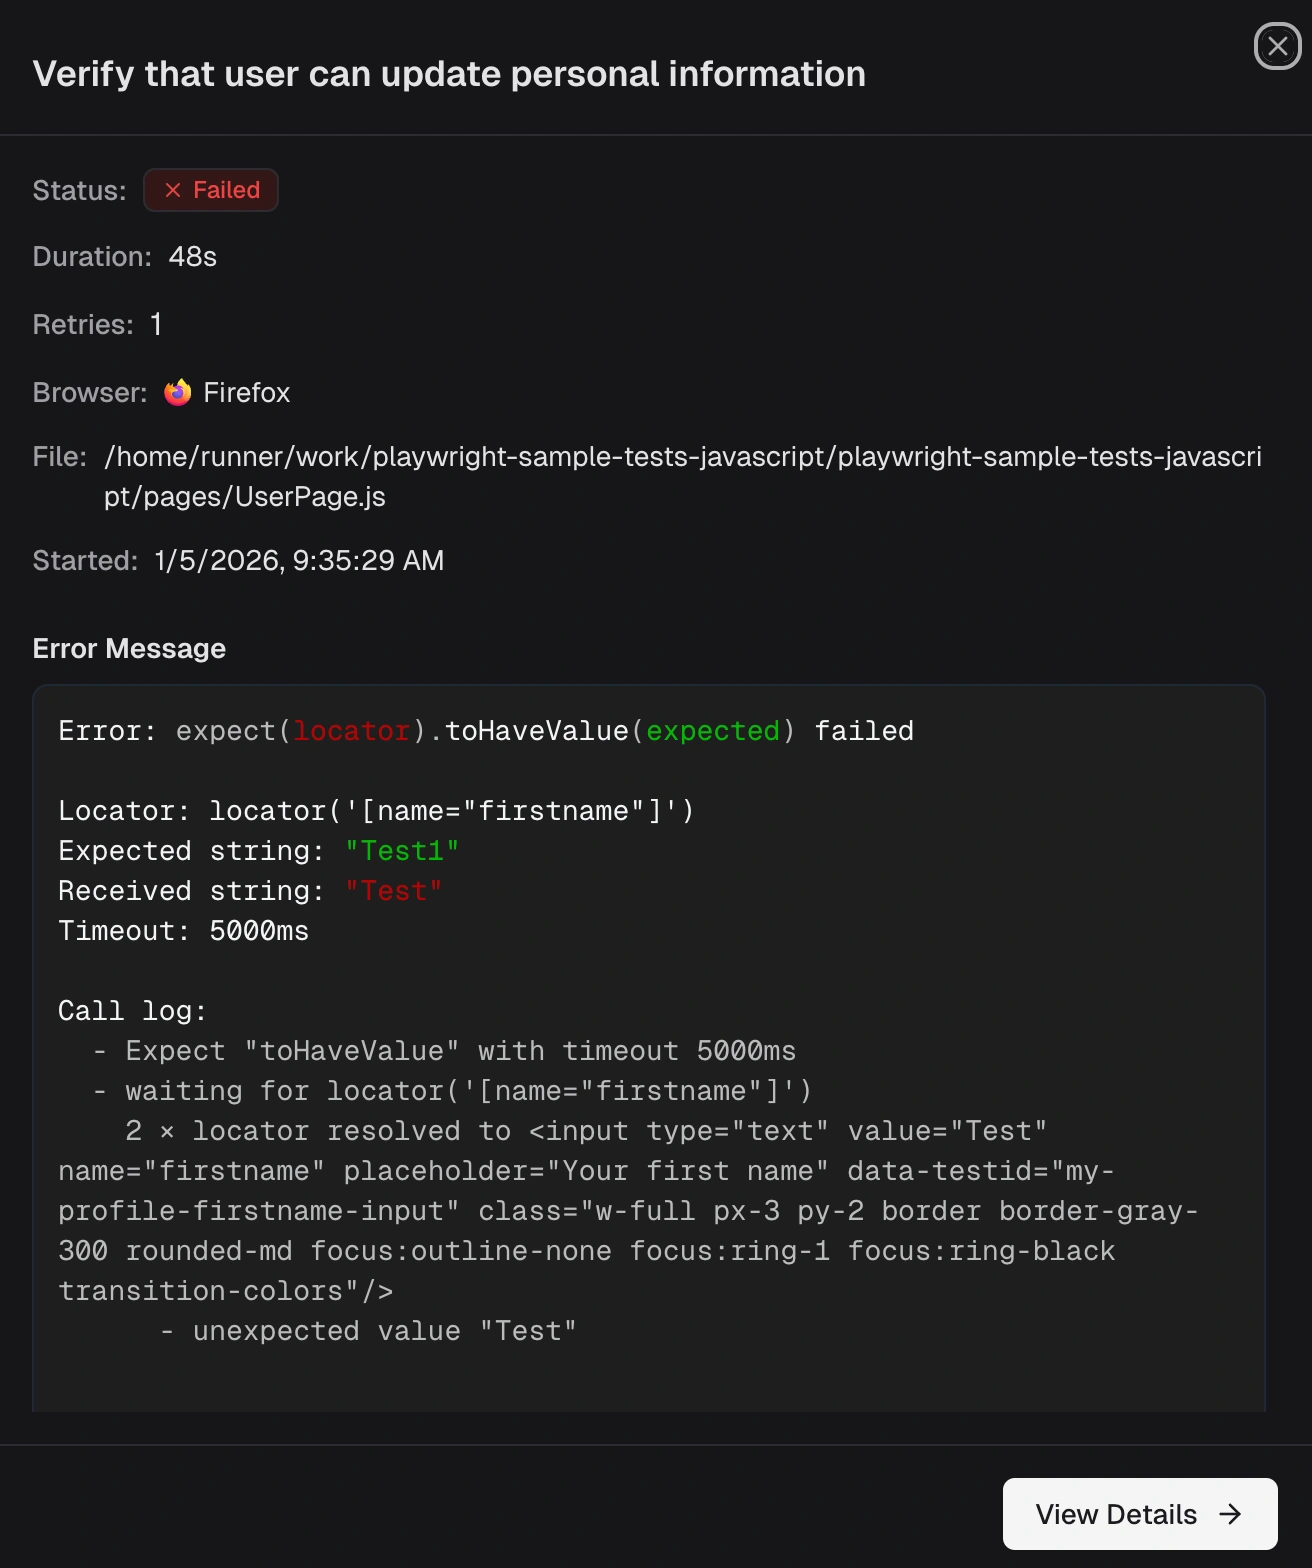
1. Header
Shows the test name and status.2. Details
| Field | What It Shows |
|---|---|
| Status | Failed or Flaky. |
| Duration | Total time the test took to run. |
| Retries | Number of retry attempts. |
| Browser | The browser or device used. |
| Started | Exact date and time the test began. |