Quick Reference
Open the dashboard
- Open your organization, then select the project
- Set the time window (Last 7, 14, or 30 days) in the top-right filter
- Review the sections for that scope
KPI tiles
Four tiles for the selected period. Each includes a trend badge versus the previous period.
Recent Test Runs
Latest runs with status icon, run ID, result badges (passed, failed, flaky, skipped), author, time, branch, and environment. View all Test Runs opens Test Runs.
Recent Pull Requests
Recent PRs with status (Merged or Open), title, number, author, and last update time.
Test Case Execution Trend
Daily passed and failed test case counts for the selected period. Hover a date for exact counts.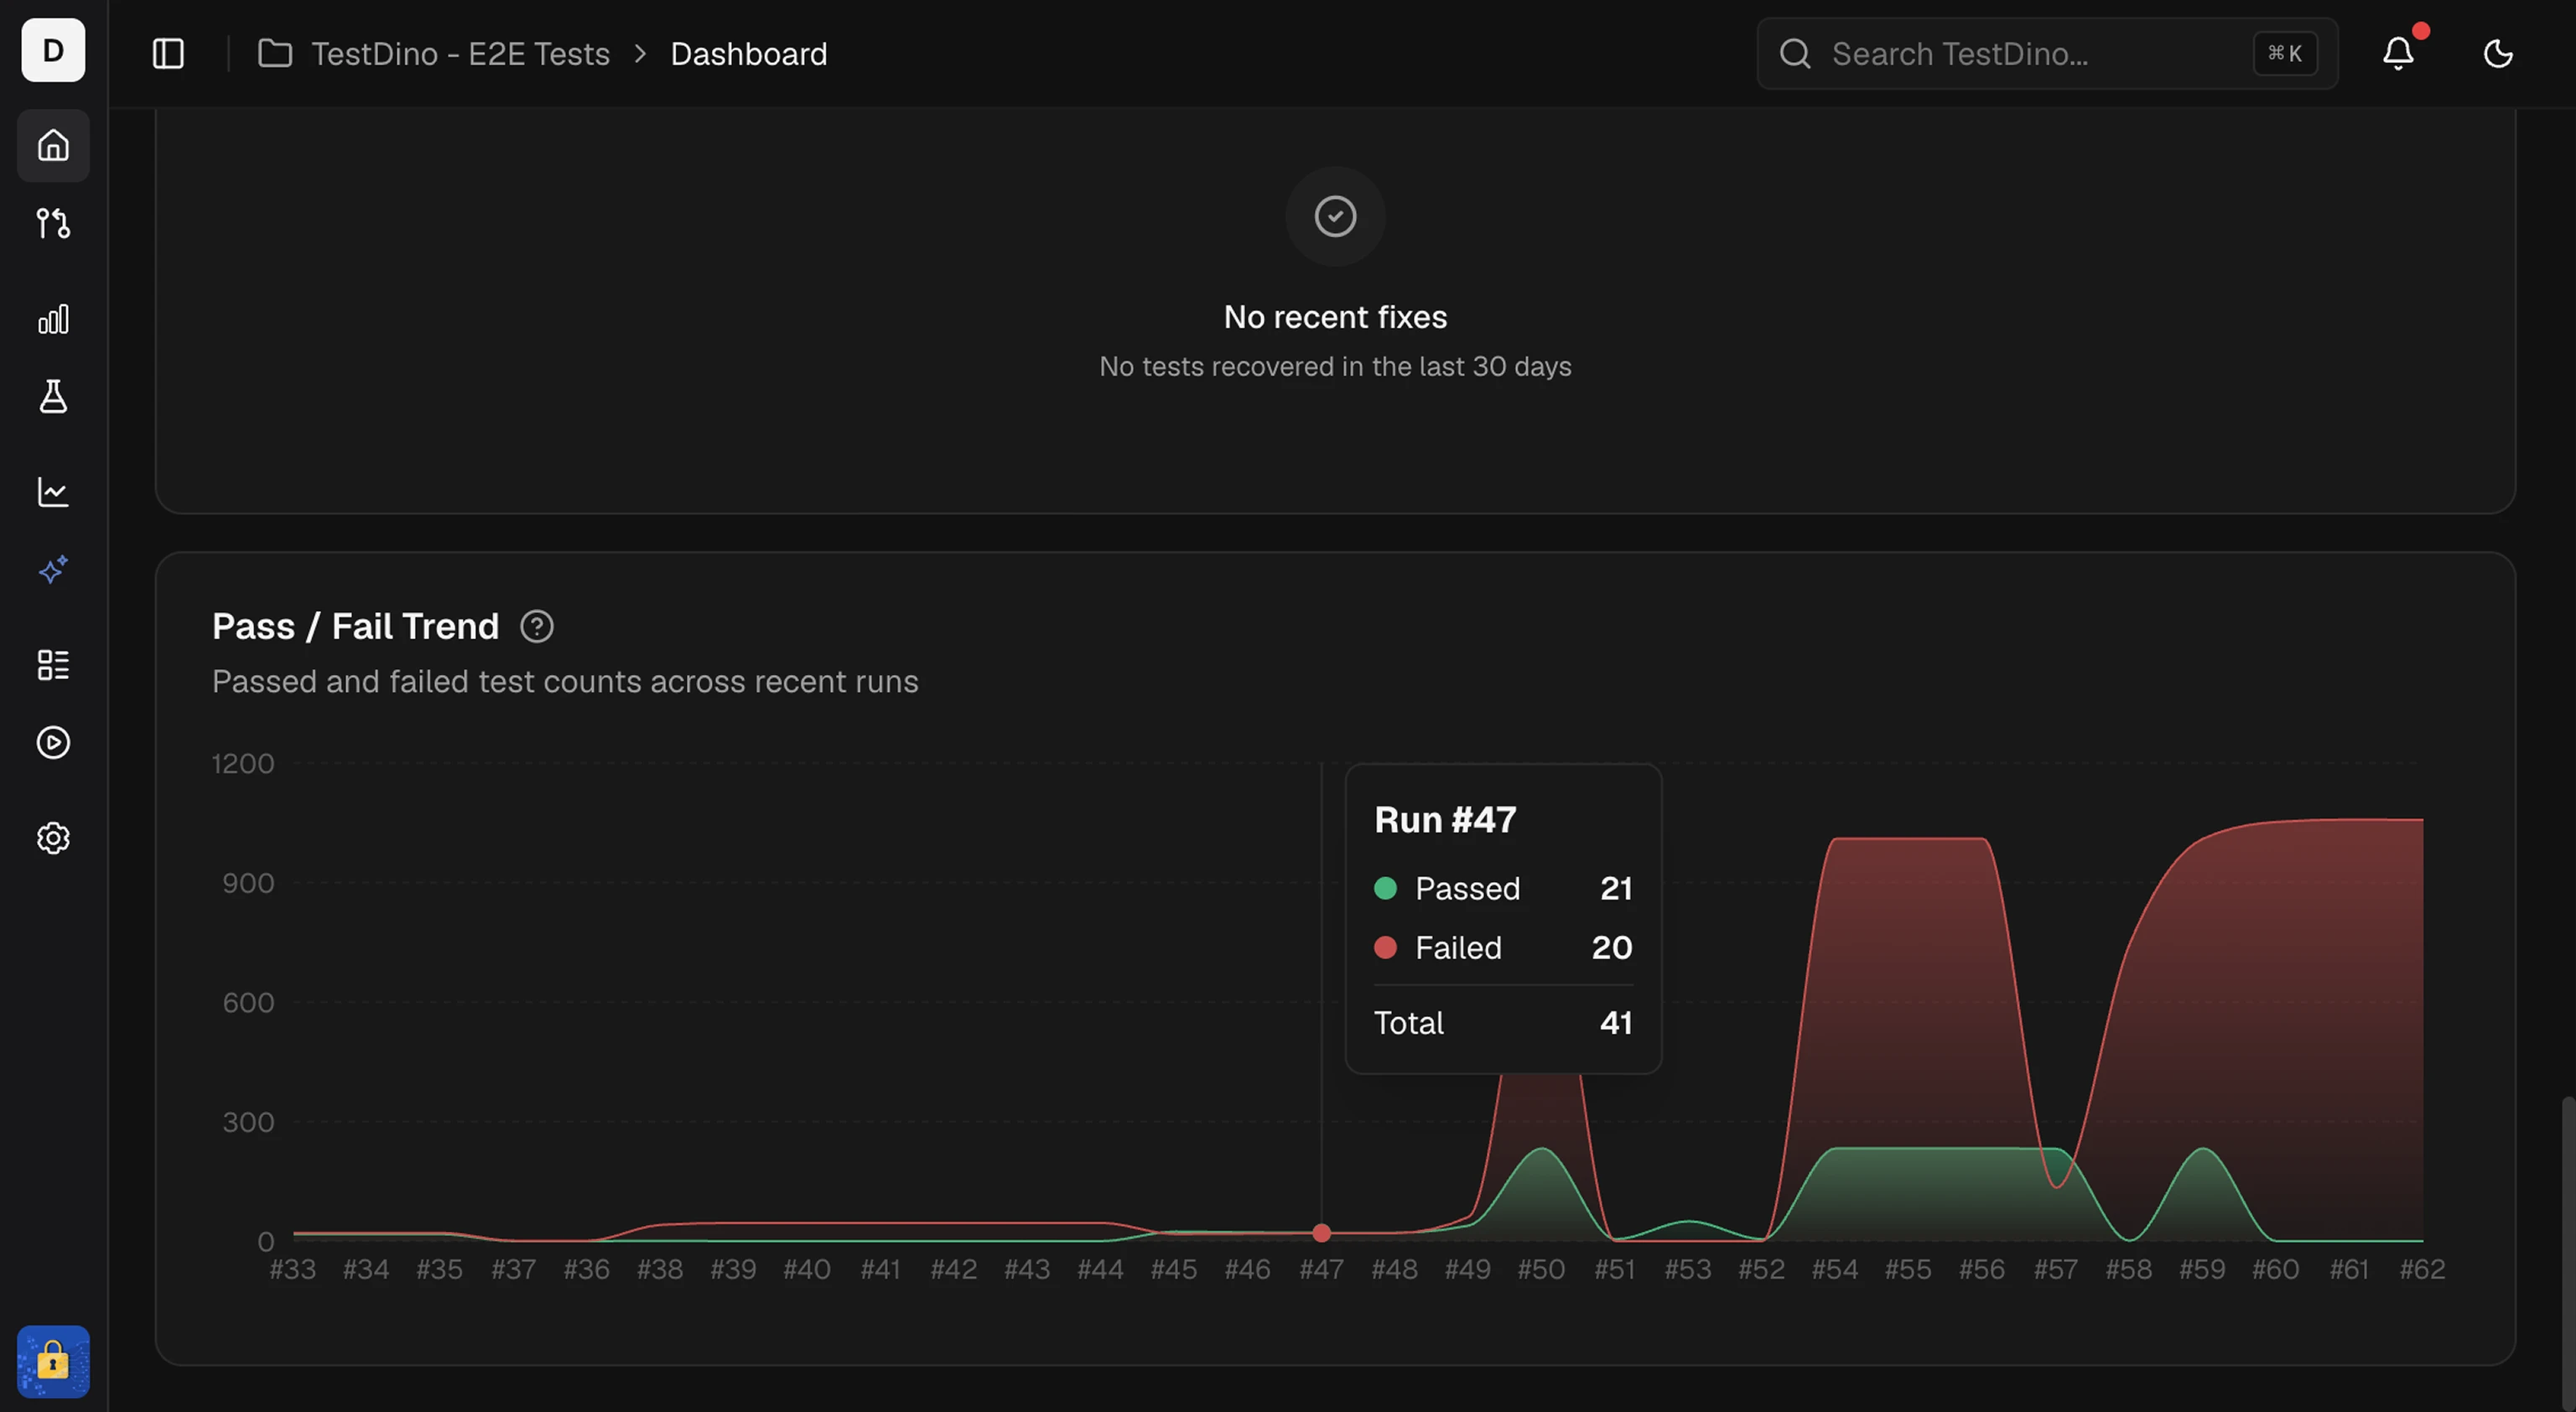
Most Flaky Tests
Tests that pass and fail across runs, ordered by flakiness. Click a test to open its latest run.
Slowest Tests
Tests ranked by duration, longest first. Click a test to open its latest run.
Test Runs
Full list with filters and detail tabs
Test Analytics
Custom dashboards for reliability and performance