Open a run
- Filter by time, environment, branch, status, or tags
- Scan result counts and open a run that needs action
- Use the detail tabs:
Search and filters
Active test runs
Runs still executing appear in Active Test Runs at the top, with a live progress bar and pass/fail/skip counts. Sharded runs show a SHARDED label and per-shard tabs.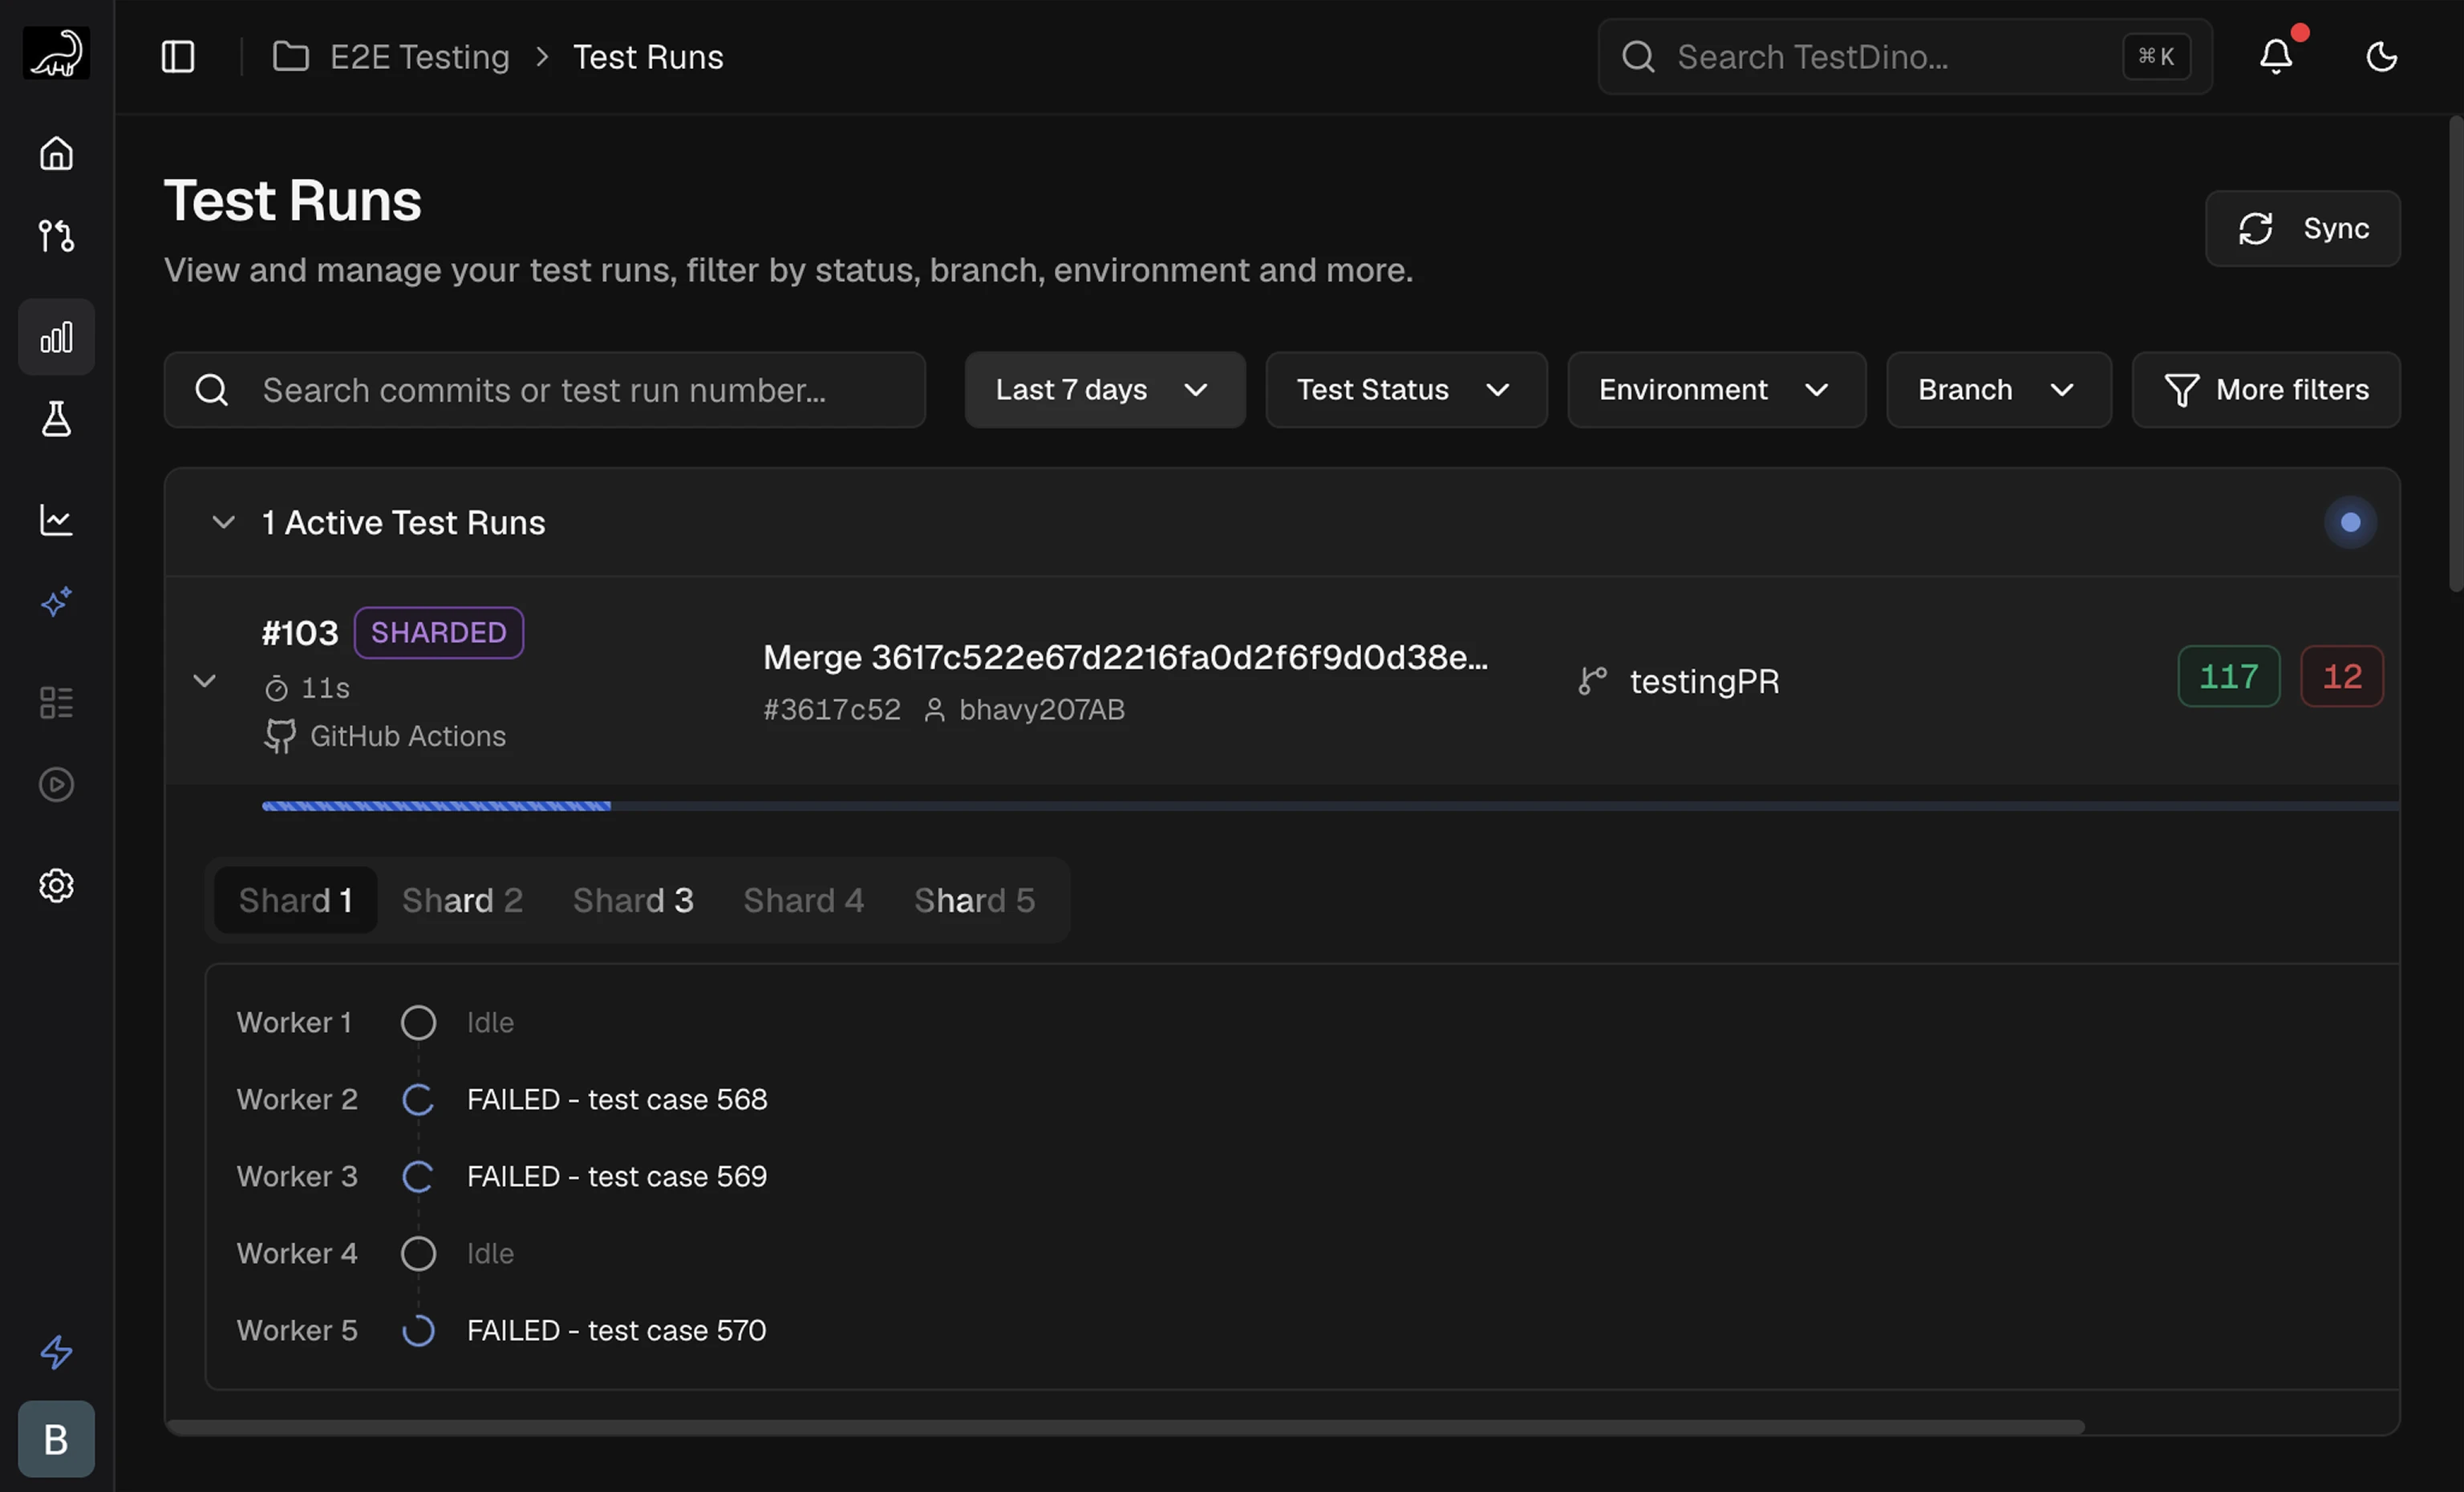
Run list columns
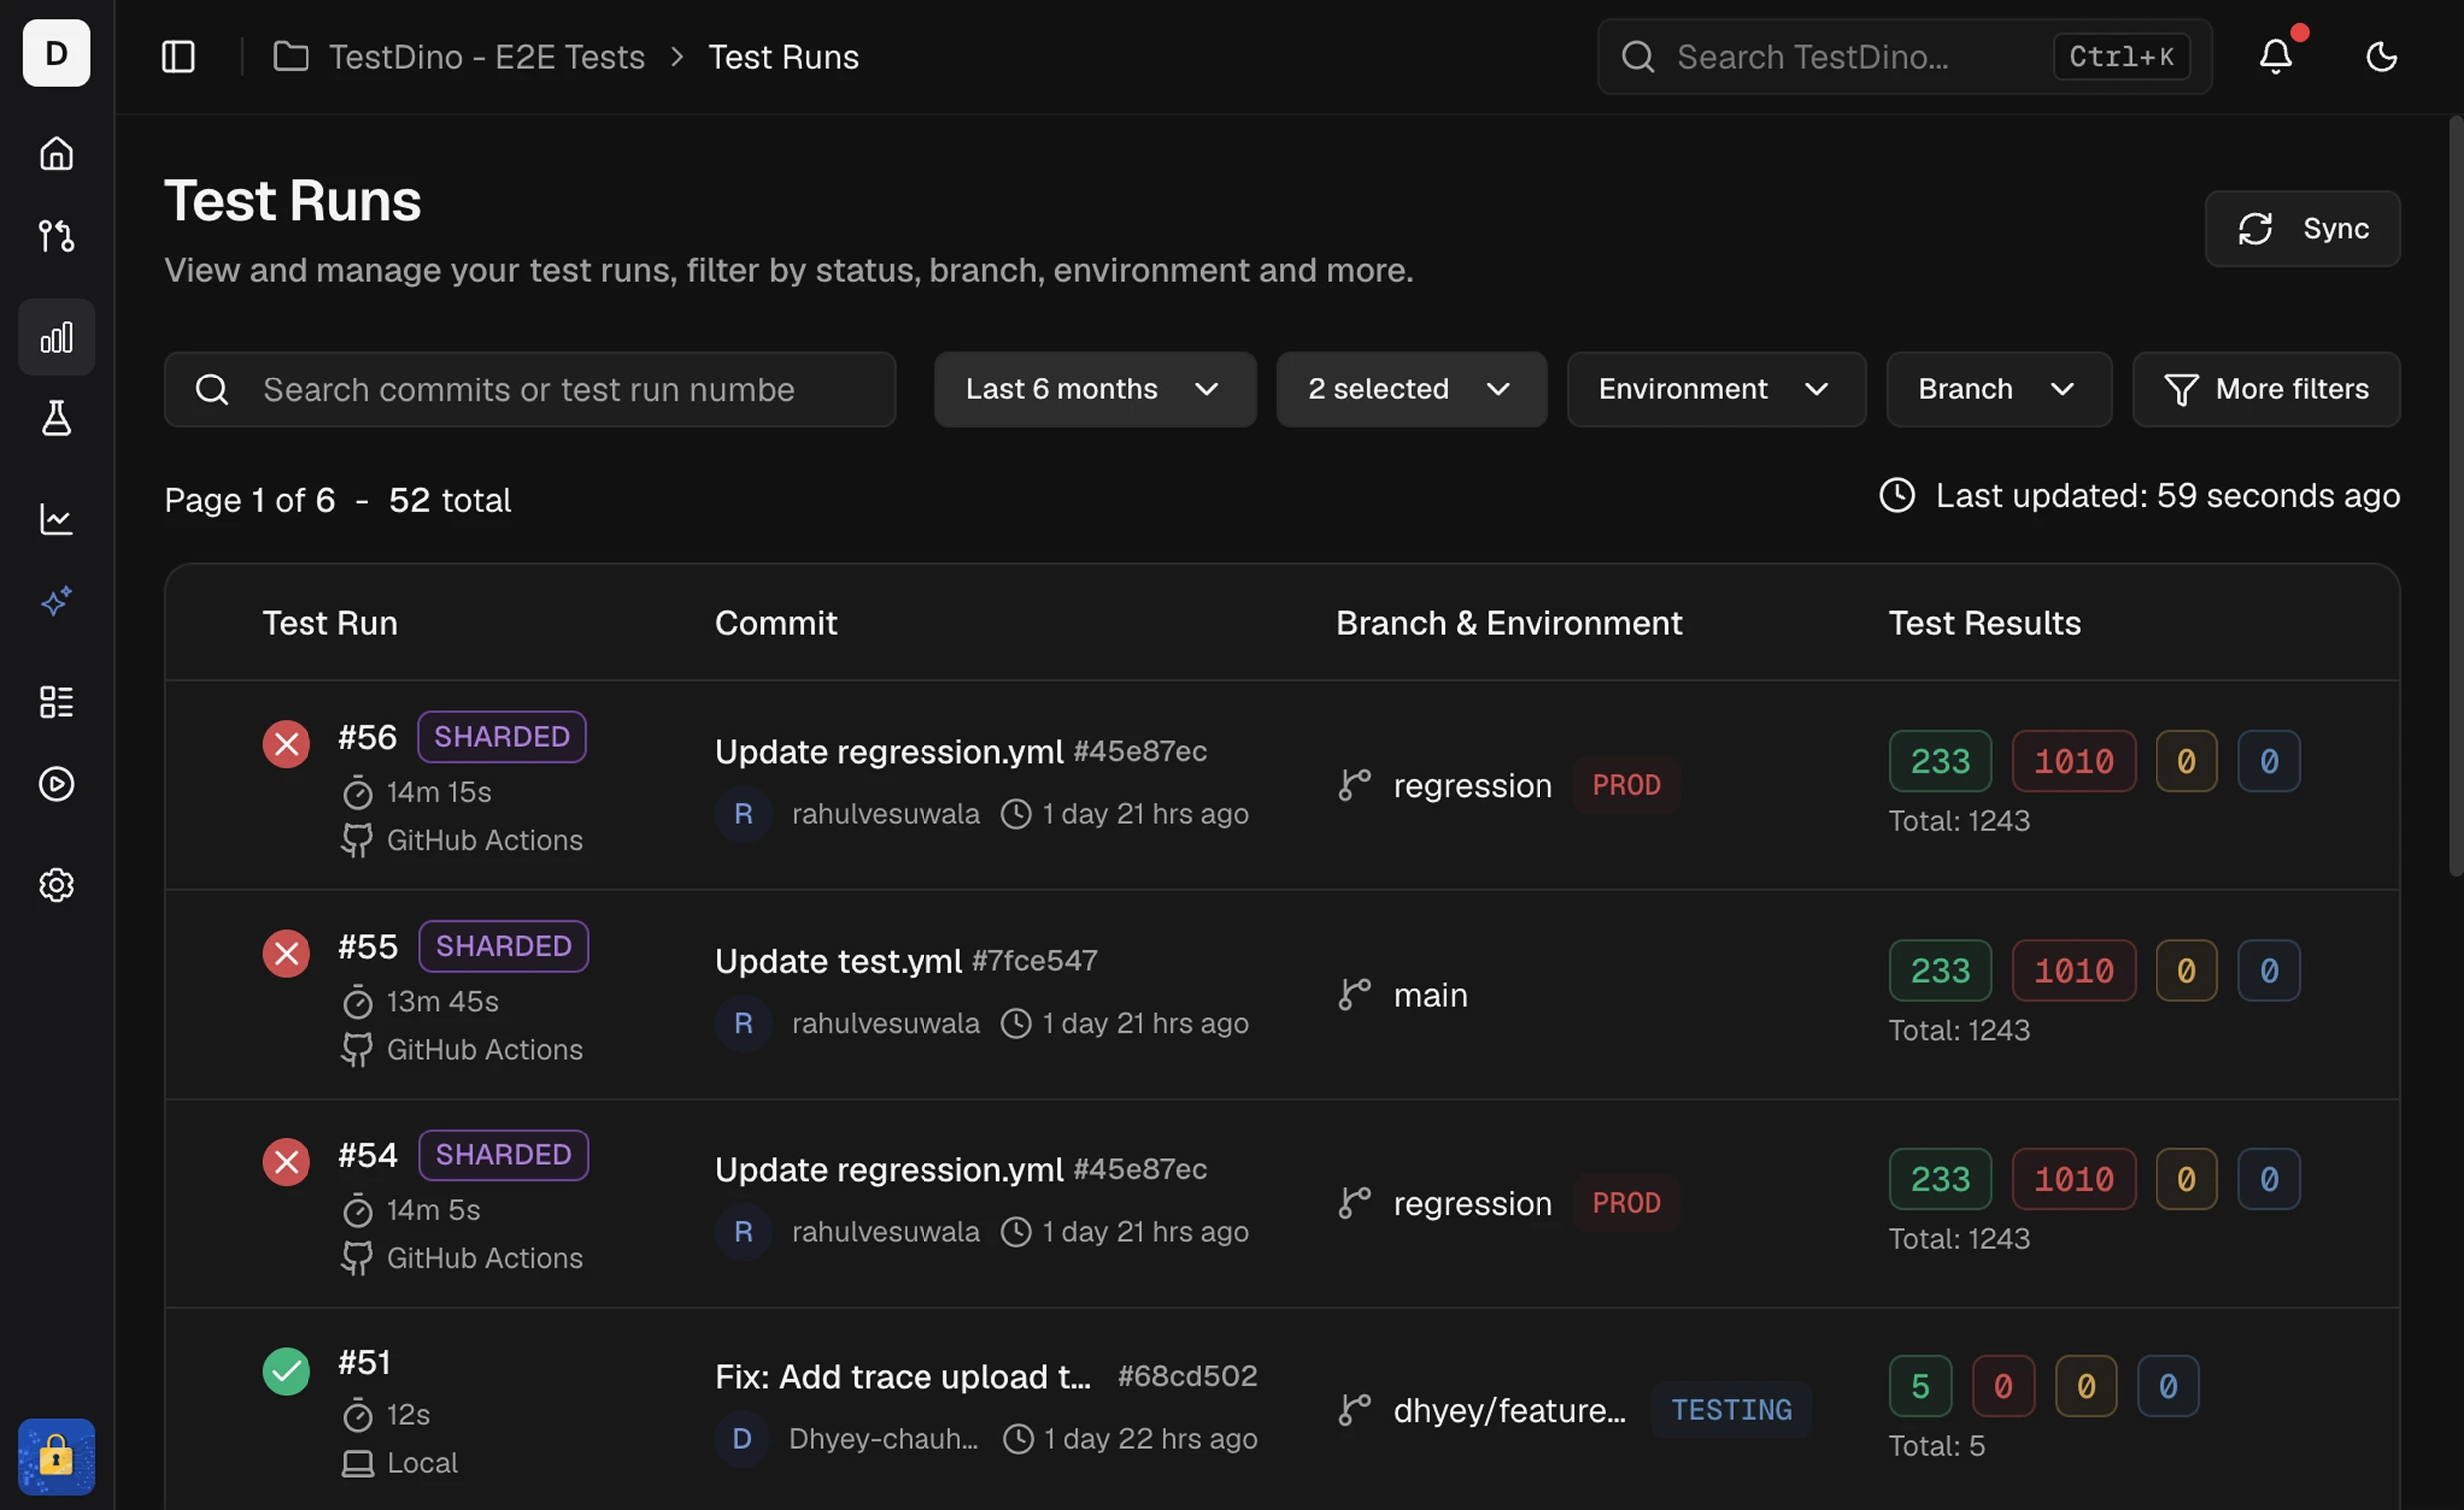
Runs that share the same commit hash and message group as attempts (for example, Attempt #1, Attempt #2). Expand the group to compare reruns for that commit.
Run-level tags
Label an entire run with--tags. These are separate from test-case tags set via annotations.
Run detail header
Shards breakdown
Sharded runs (--shard) show a Shards section on Summary. Pass the same --ci-run-id to every shard so TestDino merges them into one run. Setup: Node.js CLI → Sharded runs.
After the run finishes, imbalance (for example
3.0×) compares slowest to fastest shard. A failure-concentration note appears when one shard holds most failures. Click shard rows to filter Detailed Analysis to those shards.
Summary
Failures and flakiness by cause
Errors
Group failures by error message
Anomalies
What changed versus the baseline
Test Cases
Evidence and AI analysis per test