

Columns
Test Explorer lists every test case in a single table. Each row shows the test title and its metrics across the selected time period and filters. Click a column header to sort.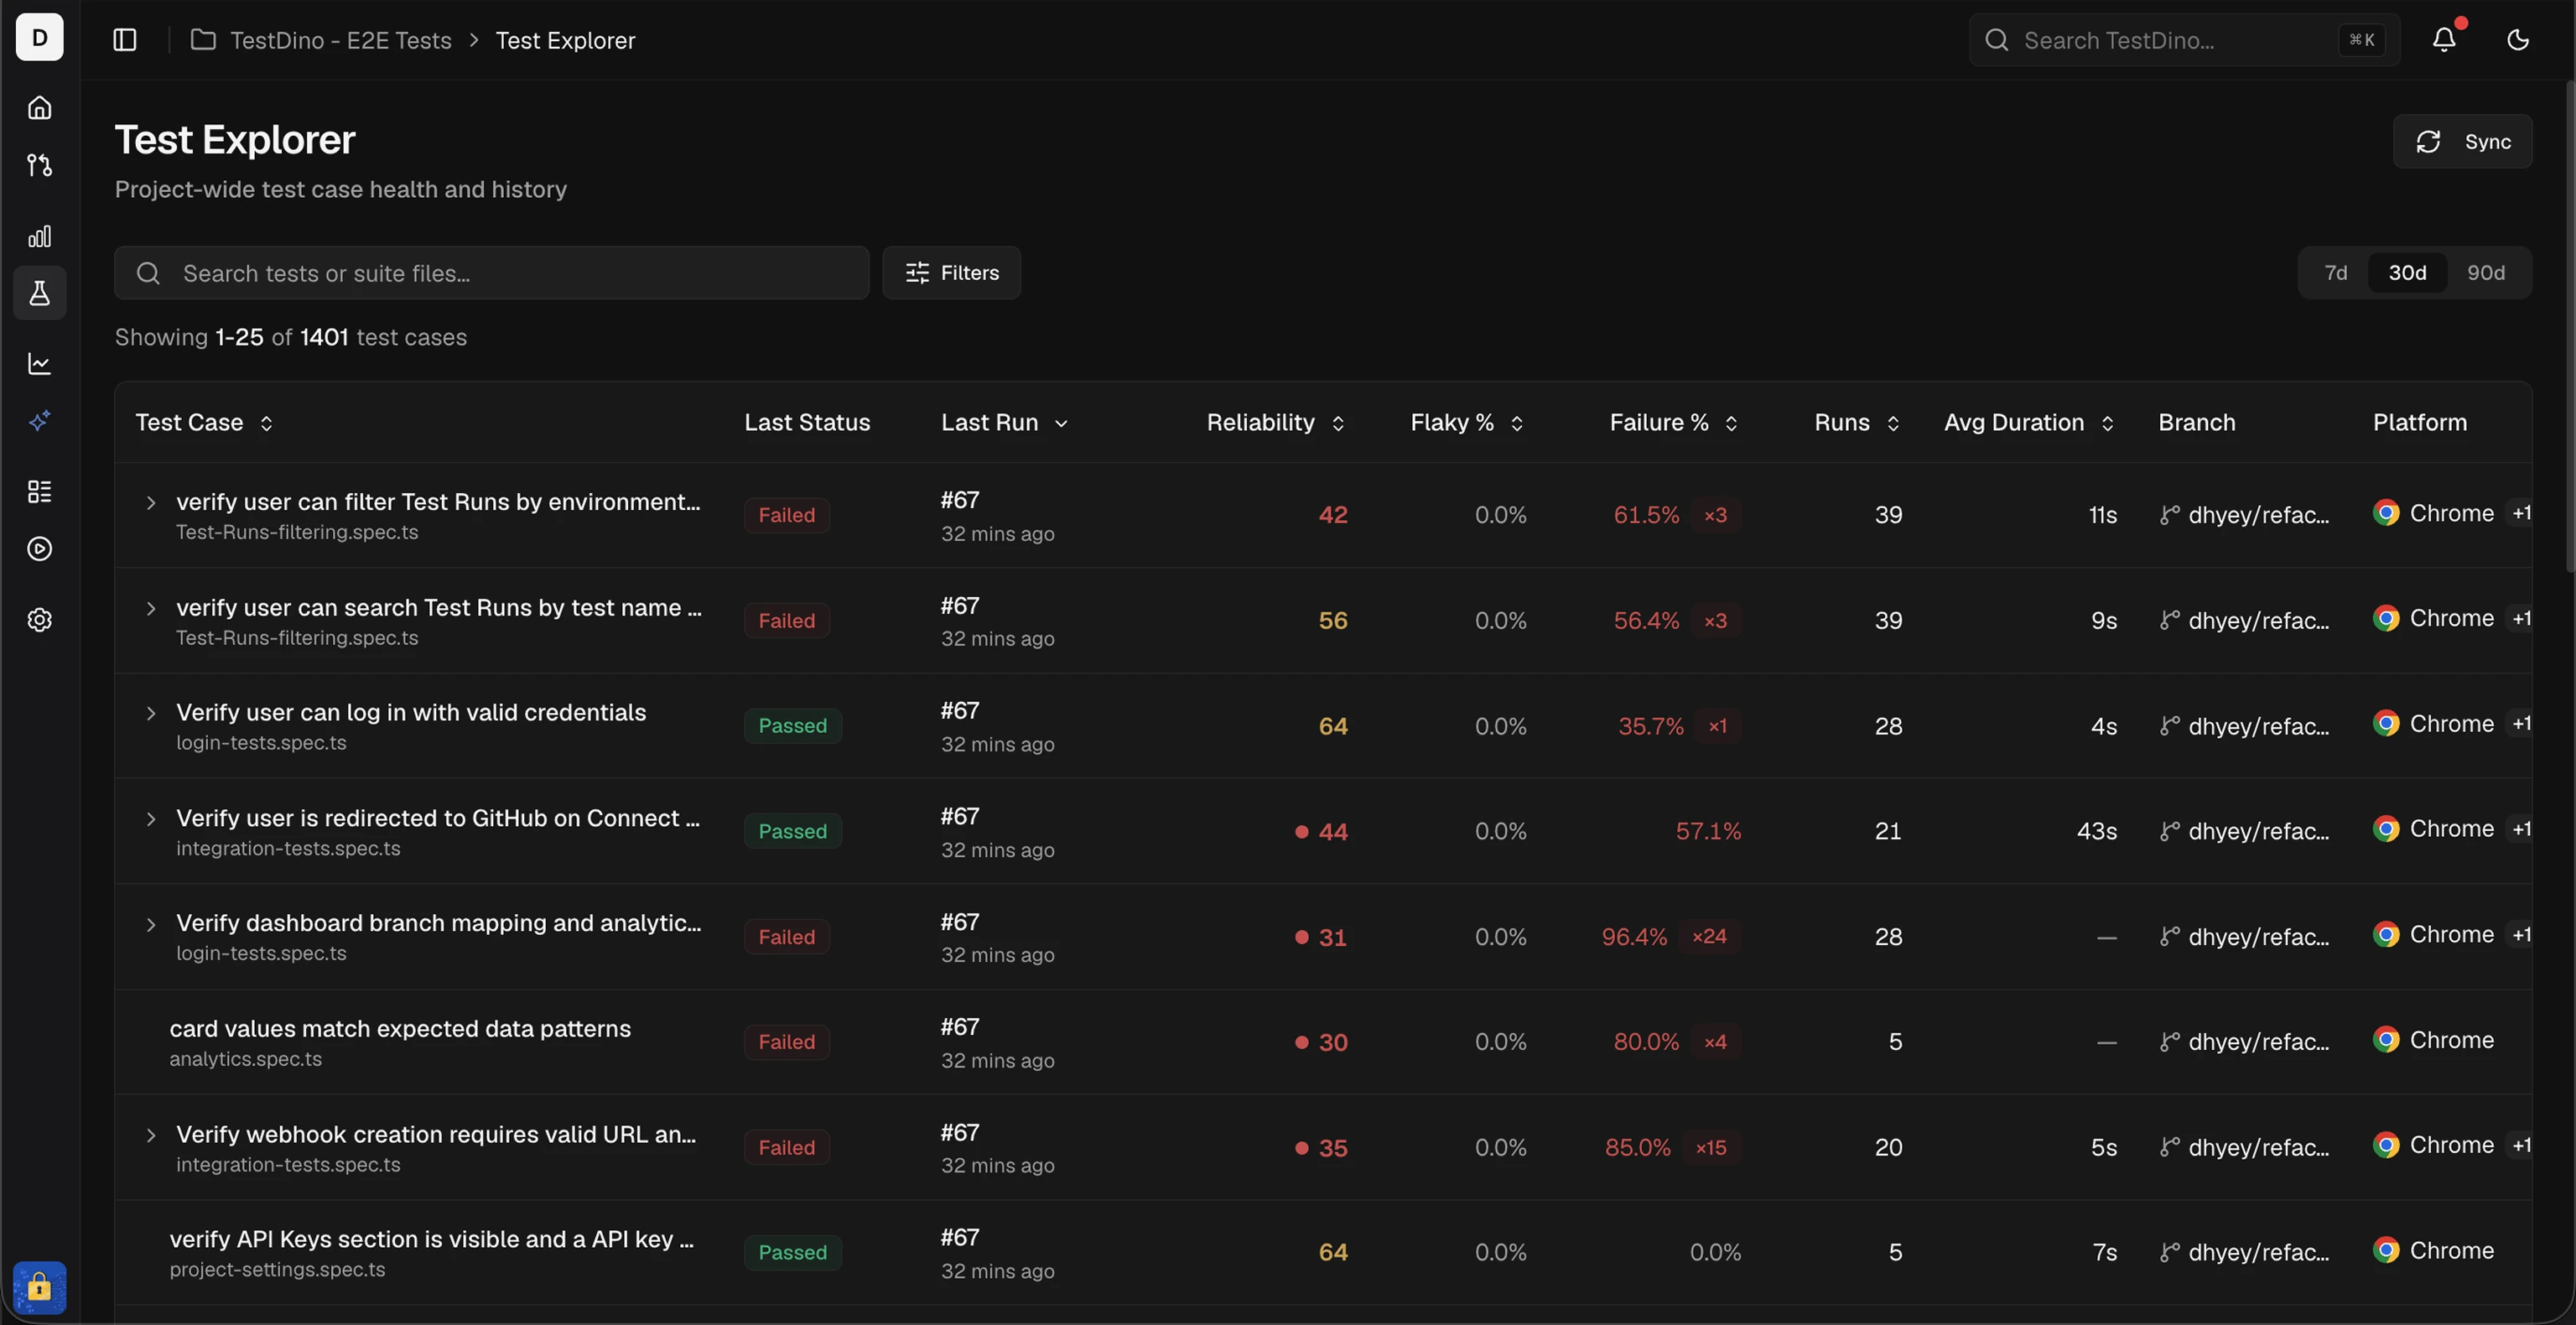
Filters & Search
Search
Type in the search bar to find test cases whose title or spec file path contains your text. The match is not case-sensitive.Filters
Activating filters updates the results count and table data immediately.
Sync
Click the sync button (top-right) to refresh data without reloading the page.Detail Drawer
Click any test case row to open the details drawer. The drawer contains 2 tabs.
Overview Tab
- Environment Analytics breaks down executions by environment (e.g., production, staging) with the columns Environment, Exec., Failed, Fail %, Flaky, Flaky %, and Avg Dur. Average duration here counts passed runs only, so it matches the average in the panel header. A failed or cut-off run does not measure how long the test takes.
- Run History displays the most recent executions with status, timestamp, and duration. Click a run to open the full test run details page.
Errors Tab
The Unique Errors (this window) list shows the distinct error messages from the test case’s most recent executions: up to 100 runs from the last 90 days, whatever time period is selected. Each error entry shows:
Use the Errors tab to identify recurring failures and track whether fixes have resolved them.
Get Started
- Set scope. Use Time Period and Environment filters to narrow the dataset.
- Identify targets. Sort by Failure % or Flaky % to surface unstable tests. Sort by Avg Duration to find slow tests, or by Reliability to rank overall health.
- Inspect details. Click a test case to view execution history, environment breakdowns, and error patterns.
Pagination
Large datasets load in pages. Use Previous and Next below the table to move between pages, and the Per page control to set how many test cases each page shows.Related
Test Runs
View all test executions
Test Cases
Manage and organize test cases
Analytics
Project-wide test analytics
Flaky Tests
Detect and fix flaky tests