

Quick Reference
How Detection Works
Flaky test detection activates automatically when retries are enabled in Playwright. No additional configuration required.playwright.config.ts
 Across multiple runs. Tests with inconsistent outcomes on the same code are flagged. TestDino tracks pass/fail patterns and calculates a Reliability score.

NoteBoth detection methods indicate that the test result depends on something other than your code.
Flaky Test Categories
TestDino classifies flaky tests by root cause:Common causes
- Fixed waits instead of waiting for the page to be ready
- Missing
awaitcauses steps to run out of order - Weak selectors that match more than one element
- Tests share data and affect each other
- Parallel runs collide on the same user or record
- Slow or unstable network or third-party APIs
- CI setup differs from local environment
Where to Find Flaky Tests
Dashboard
Open the Dashboard. The Most Flaky Tests panel lists tests with the highest flaky rates in the selected period. Each entry shows the test name, spec file, flaky rate percentage, and a link to the latest run. Click any test to open its most recent execution.
Test Run Summary
Open any test run. The Summary tab shows flaky test counts grouped by category: Timed out, Network error, Assertion failed, Element not found, File system error, and Unclassified error. Click a category to filter the detailed analysis table.
Test Case History
Open a specific test case and go to the History tab. The Reliability score rates the test from 0 to 100, higher is better. It combines how often the test passed, how rarely it was flaky, whether retries recovered it, and whether it fails chronically. 80 and above is healthy, 50 to 79 is shaky, and below 50 is unreliable. The Last Flaky tile links to the most recent run where the test was marked flaky.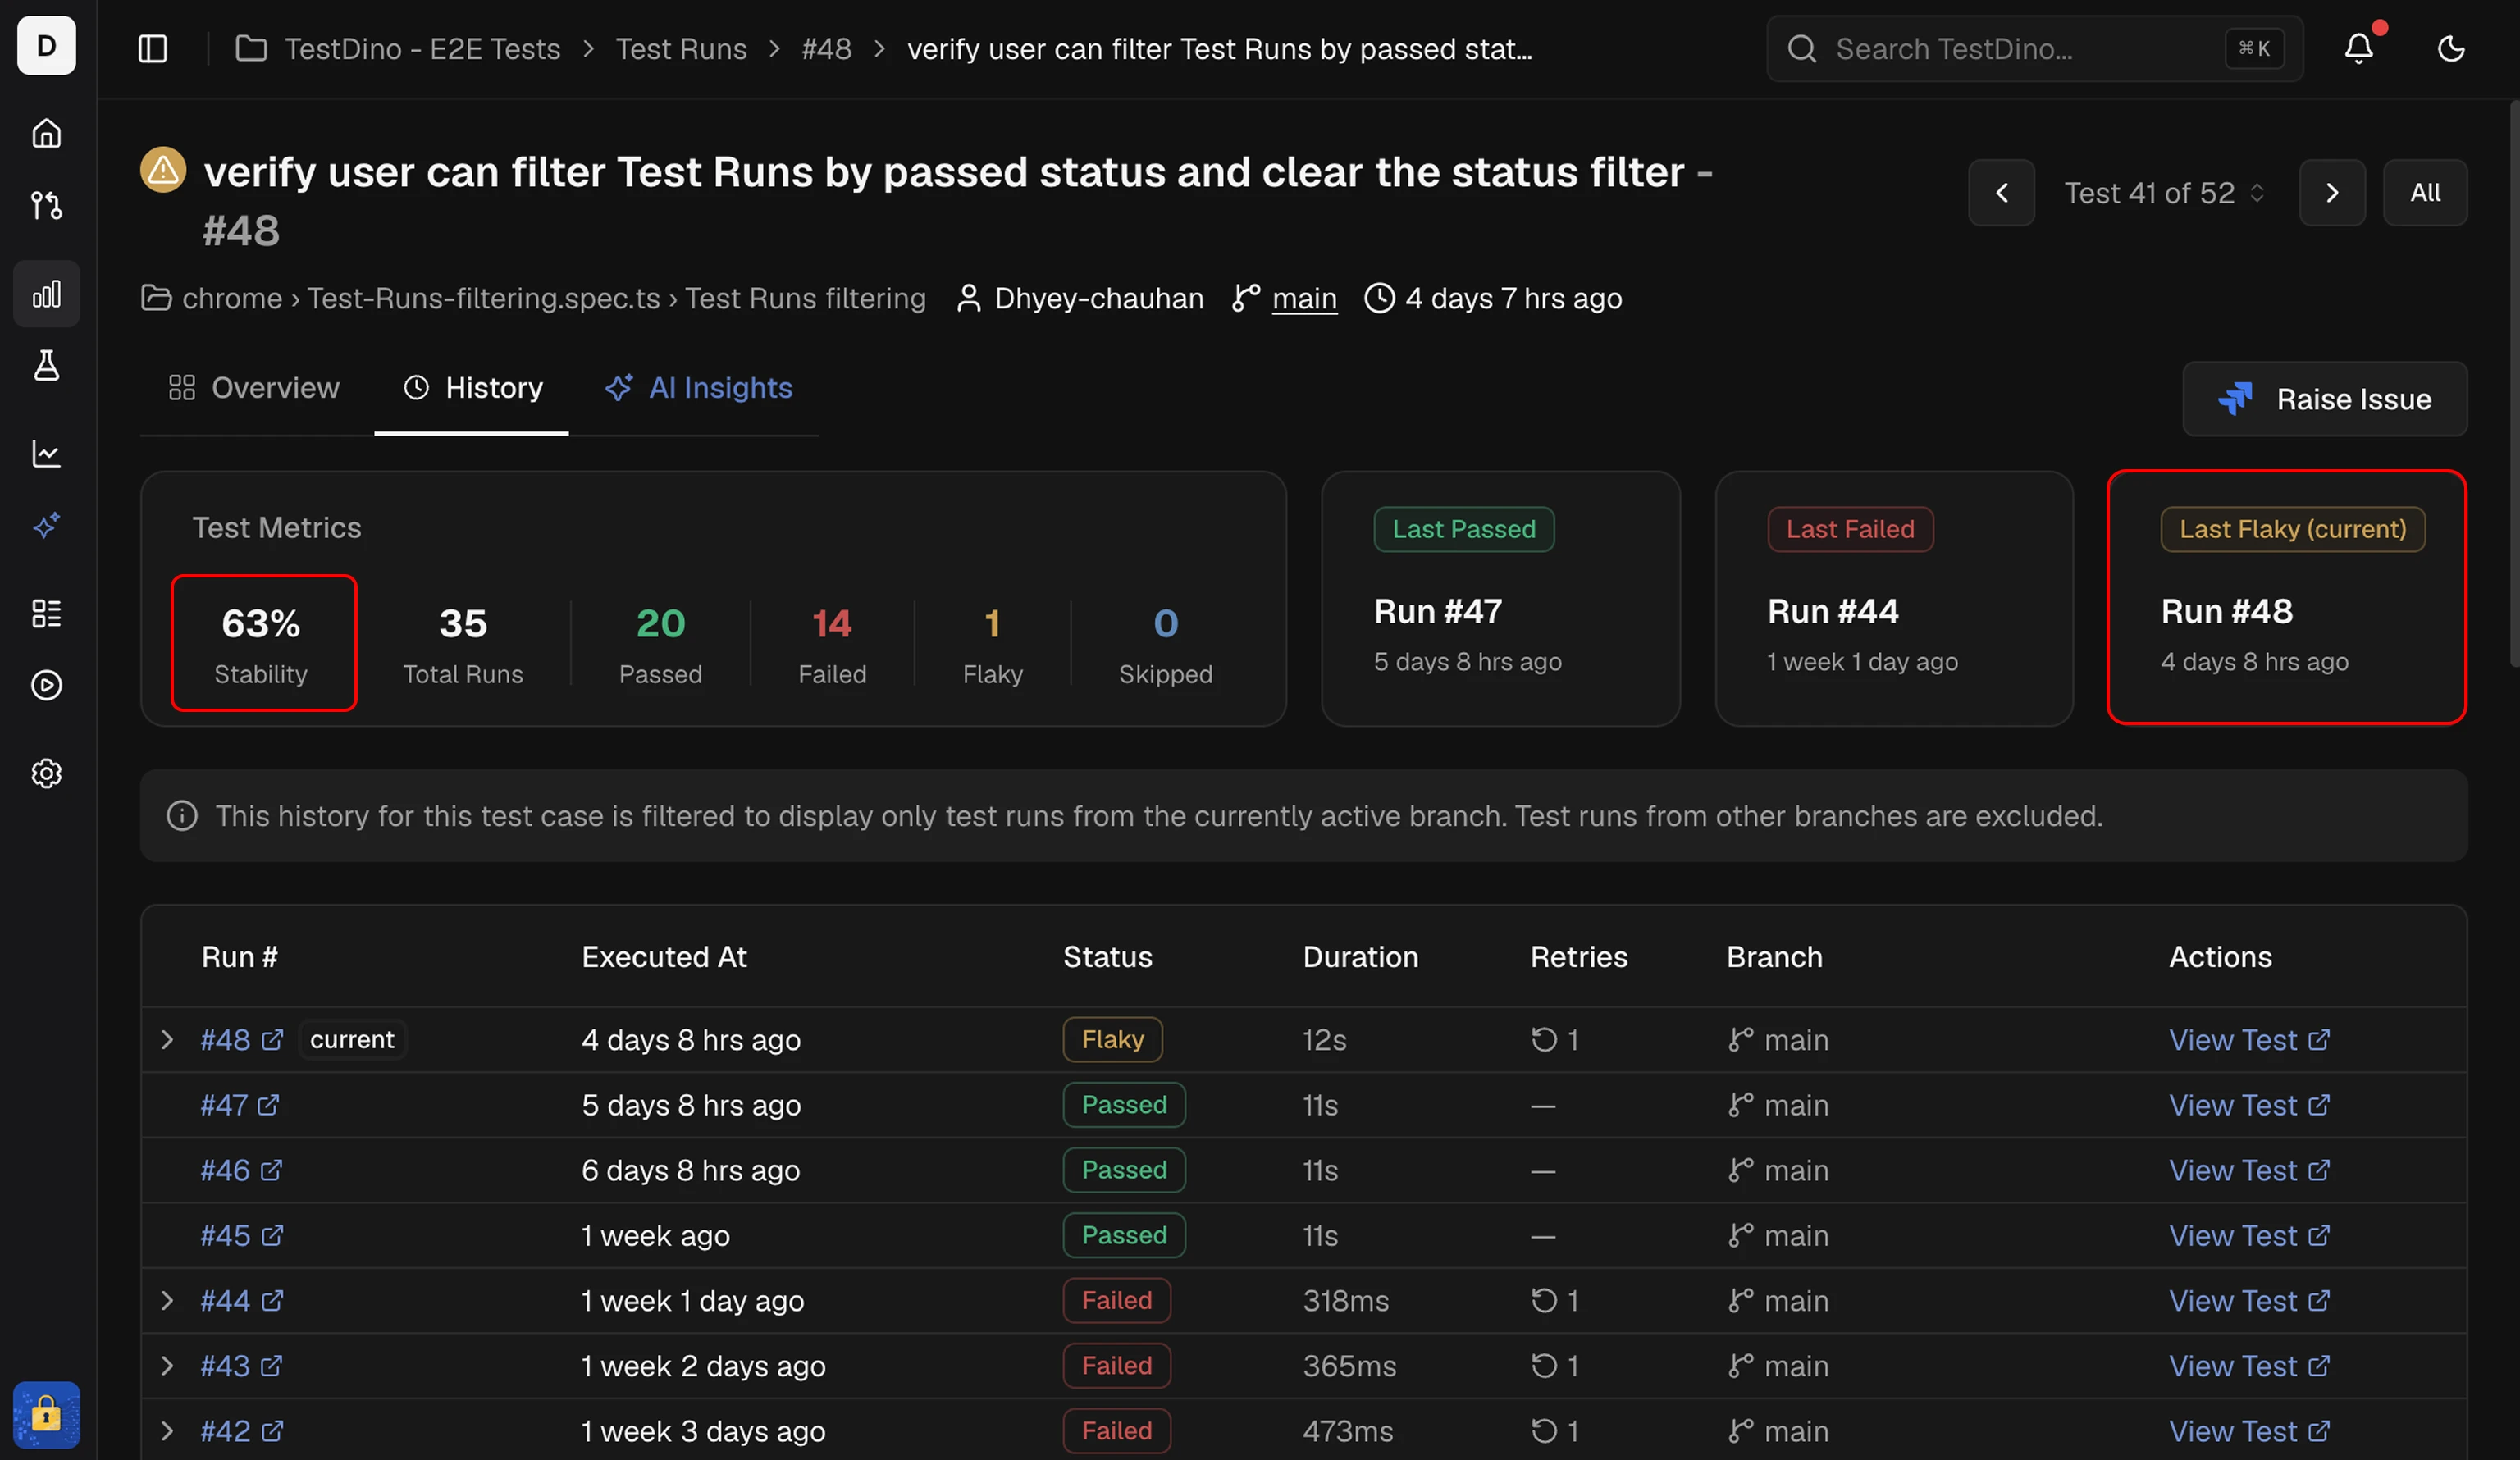
Test Explorer
Open Test Explorer from the sidebar. The Flaky % column shows the percentage of executions with flaky results for each spec file or test case. Sort by Flaky % to find the most unstable tests across the project.Flakiness trend
Add the Flakiness trend widget to an analytics dashboard to track flaky-run rate over time, and the Flakiest tests widget to list the tests with the most unstable results. Set a widget’s environment filter to compare stability across staging, production, and other environments.NoteHigh flaky rates in specific environments suggest environment-dependent issues like resource constraints or service availability.
CI Check Behavior
GitHub CI Checks handle flaky tests in 2 modes:
See GitHub CI Checks for configuration details.
Quarantine a Flaky Test
A flaky test that blocks pull requests can be quarantined: it keeps running and reporting, and its failures stop failing the build until it is healthy again or its end date arrives. Quarantine it from the Test Controls button on its test case page or in Test Explorer, or from the Candidates tab, which lists tests that were flaky in more than 5% of their test runs in the last 30 days and are not quarantined or critical. Learn how in Test Controls.Export Flaky Test Data
Use the TestDino MCP server to query flaky tests programmatically:
See TestDino MCP for more details.
Related
Test Explorer
Analyze flaky rates across spec files and test cases
GitHub CI Checks
Configure flaky handling in CI
TestDino MCP
Query flaky data with AI
Analytics
Project-wide test analytics