

Layout
The tab has a search bar, a Category filter, a Tag filter, and an Expand / Collapse All control across the top. A caption on the same row reads “N error groups affecting M tests”. Below them come the error groups themselves grouped under categories.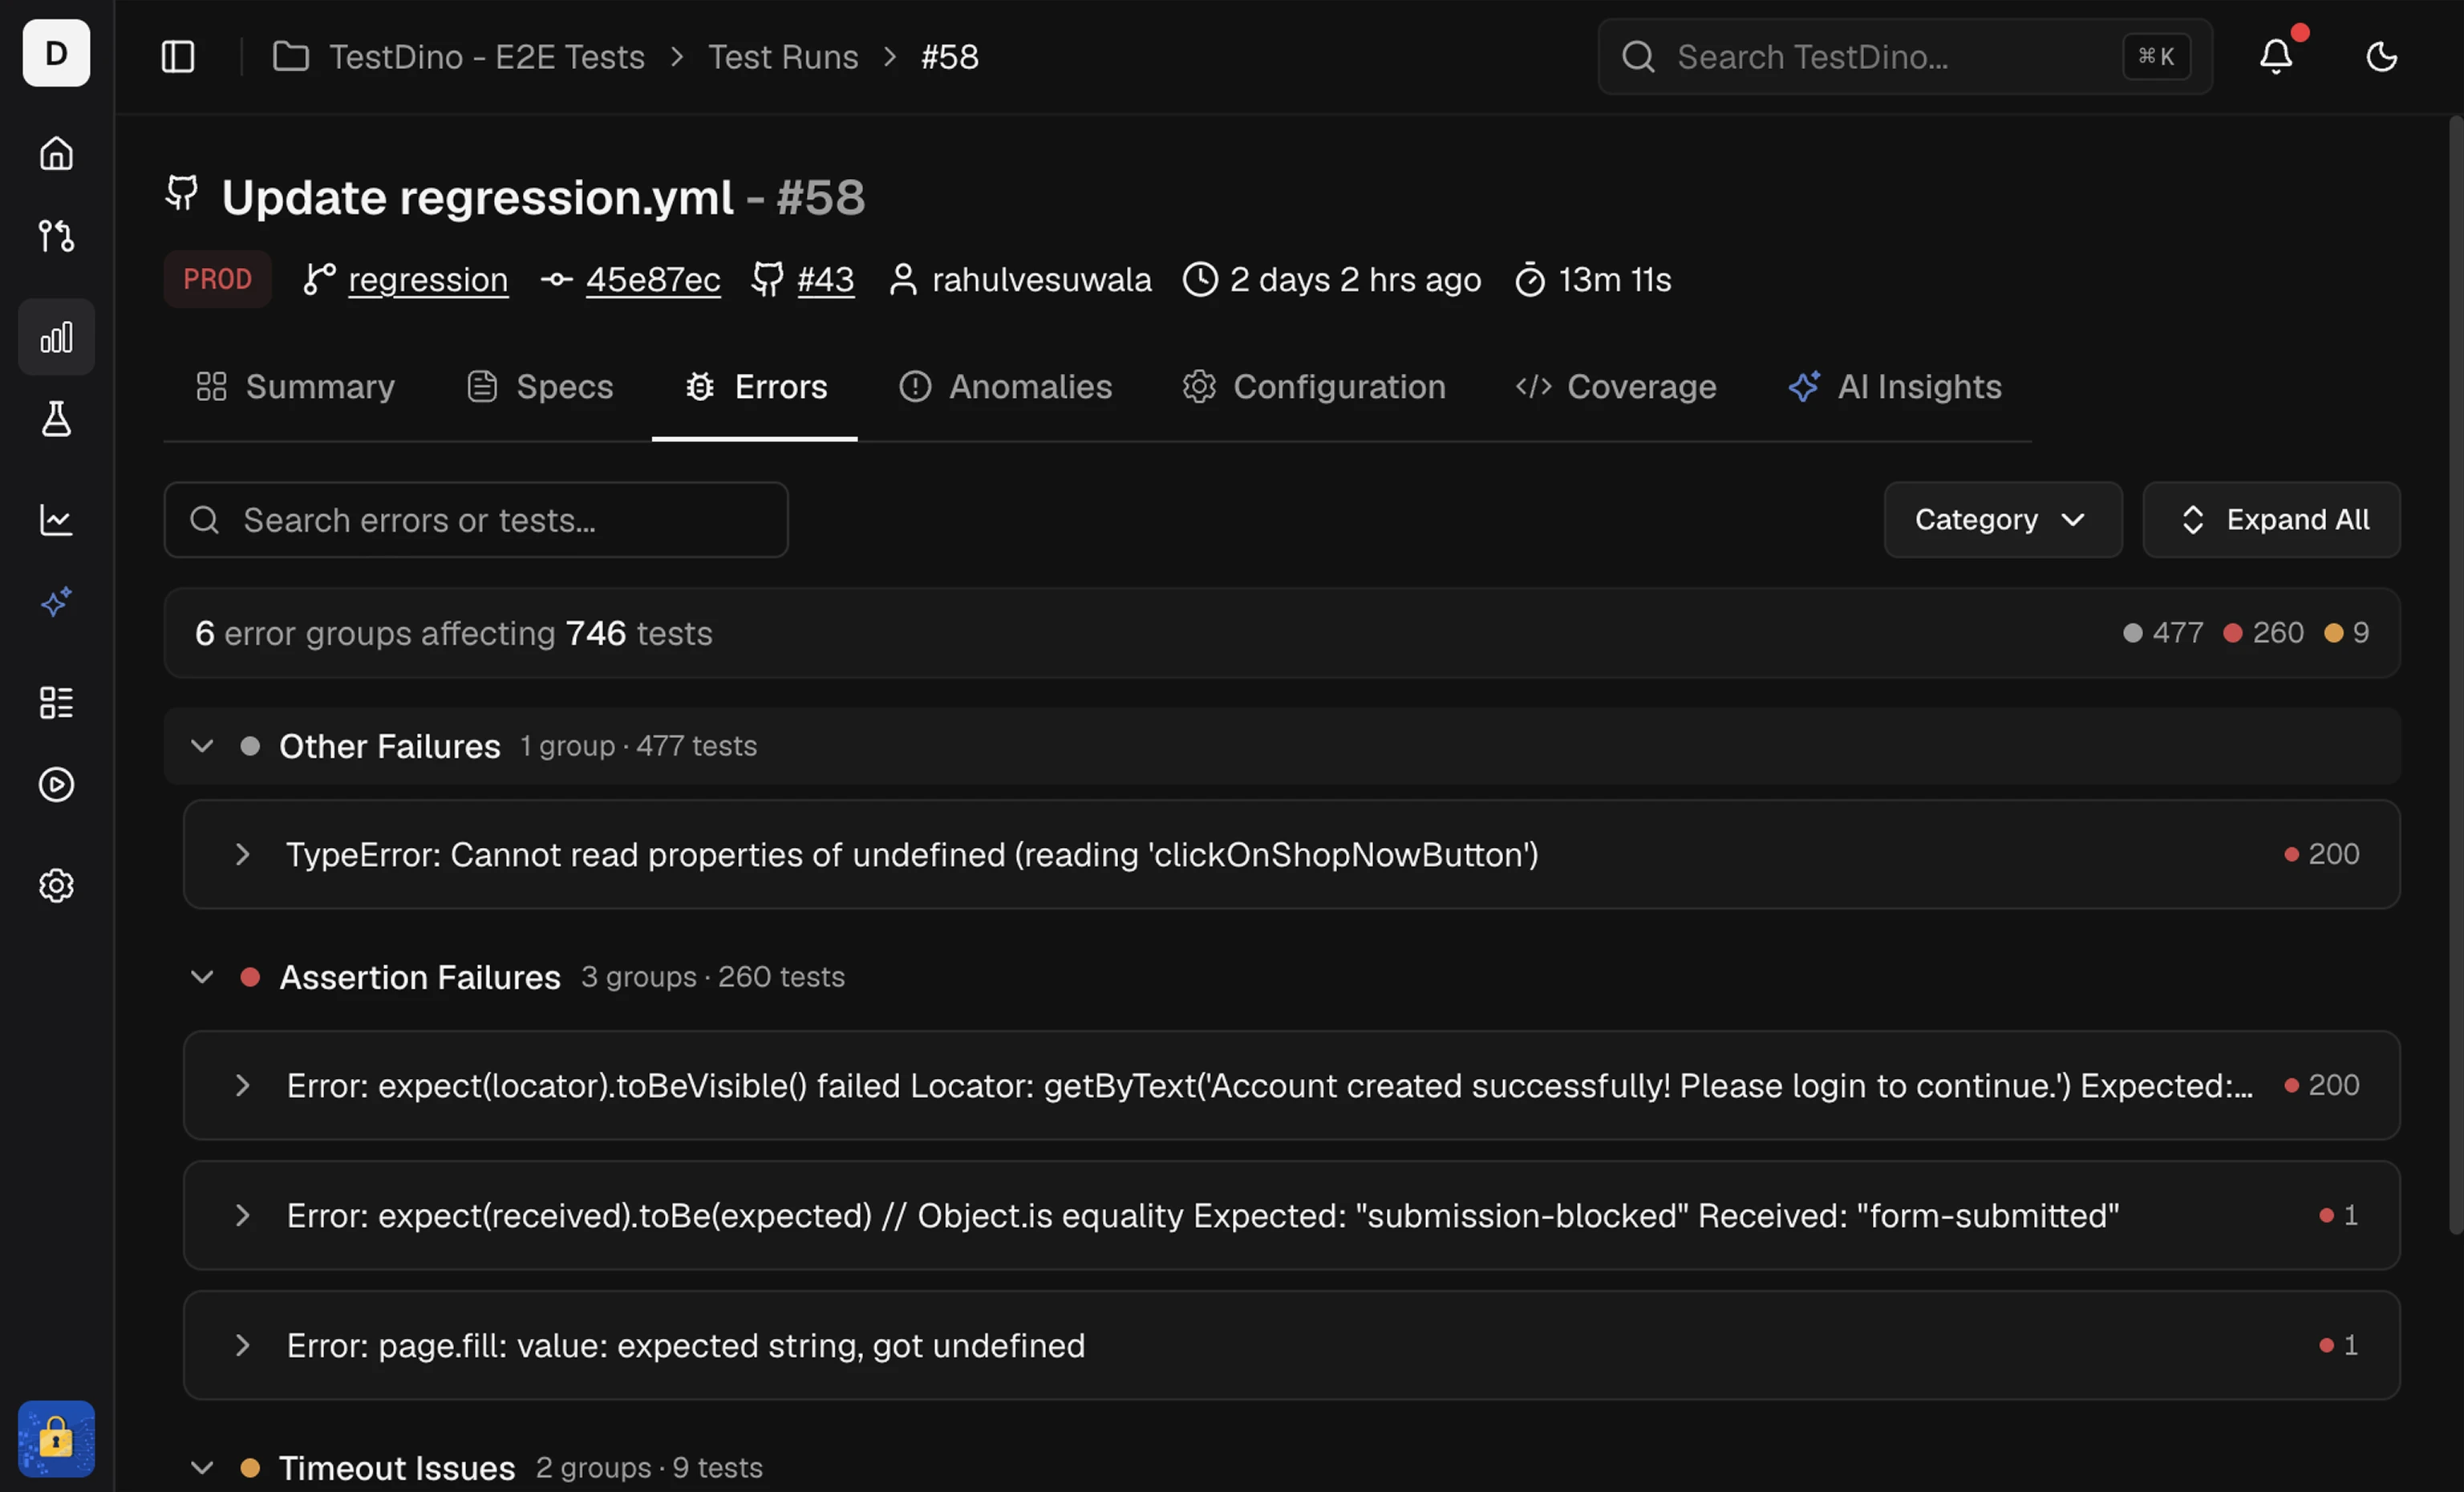 Categories are collapsible; each header shows how many groups and tests it holds.
Search
Search by test name, full title path, error text, or tag. Results update as you type, and matching groups expand automatically so you can read them without clicking.Category filter
Filter the list to one or more error categories. Open the Category dropdown, select the categories you want, and the list narrows to matching groups. Each category in the dropdown shows its group count. Selected categories appear as removable chips with a Clear all option.Tag filter
Filter error groups by test-case tags. Open the Tags dropdown, search or pick one or more tags, and the list shows only groups containing tests with those tags. Tag badges on a group card are also clickable, so selecting a tag from a card toggles the same filter (for example@smoke or @checkout).
Expand / Collapse All
The control on the right toggles between Expand All and Collapse All, opening or closing every category and error group at once.Error Groups
Each card is one unique error, grouped by the failure’s cause. Grouping keeps the part of the error that names what failed and why: the element, the expected value, and the reason. It ignores what changes from run to run: IDs, paths, and timing numbers. The card header shows:- The error signature text
- Failed and flaky counts as colored dots
- Up to 2 tag badges from the affected tests
Test Case Rows
Each test row inside a group shows, in order:- Status icon: X for failed, a triangle for flaky
- Test name: the full test case title
- Duration: how long the test took, next to a timer icon
- Browser: the browser or device as an icon (Chromium, Firefox, WebKit, Safari, Edge, Android, iOS, and more)
- Retries: the retry count, shown only when a test retried
A run over 5,000 tests shows a banner: counts and error groups reflect only the first 5,000 tests. A group with more tests than it lists carries a note that only the first N of M tests with that error are shown, and suggests search to narrow the list.
Side Panel
The side panel opens from the right and shows one test case without leaving the Errors tab.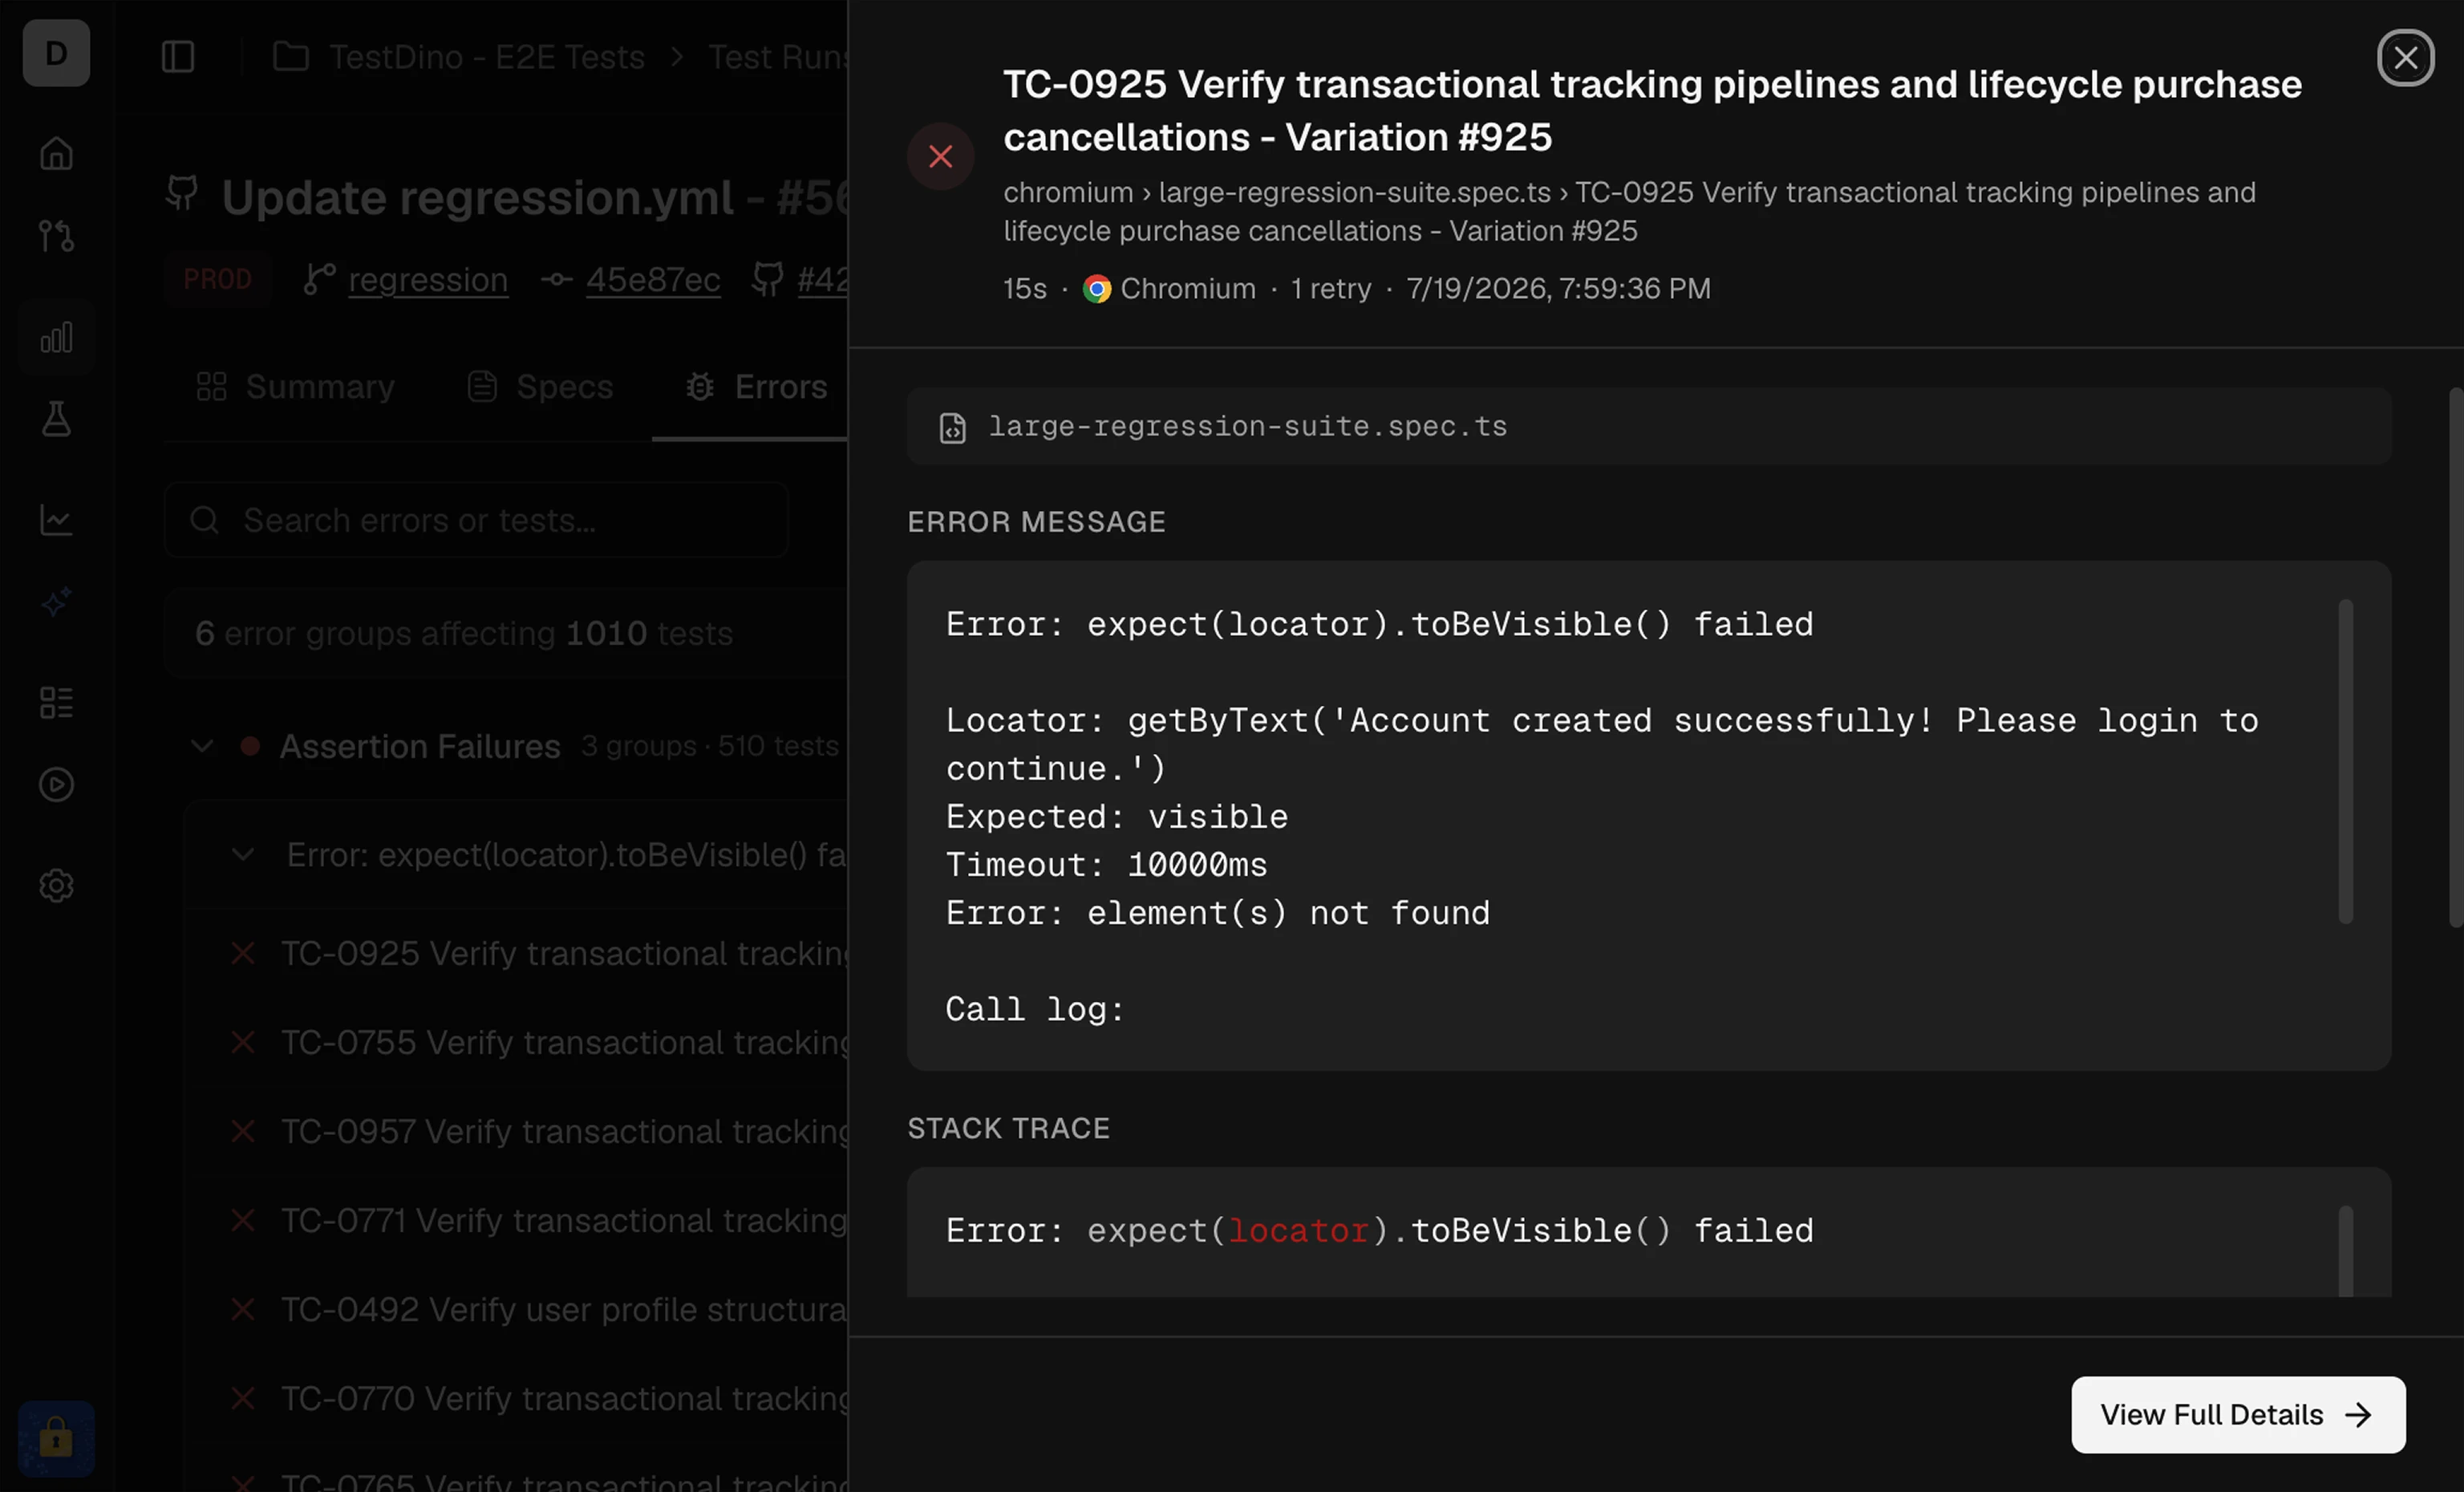
Header
The test name, its status as a colored icon, the spec file path, and an inline metadata line: duration, browser, retry count, and how long ago the test ran.Error Message
The Playwright error text for the failing attempt, with ANSI color codes stripped. The Stack Trace keeps its colors.Stack Trace
The call stack at the point of failure, shown when the test recorded one. Use it to trace back to the exact line in your test or application code.View Full Details
Opens the full test case details page. From there you reach the Overview, History, Annotations (when present), and AI Insights (when AI insights are on) tabs for deeper analysis.Related
Summary
Group failures by cause
Specs
Review results by spec file
Flaky Test Detection
Why tests pass on retry and how to fix them
Analytics
Track reliability and duration trends over runs