Run History
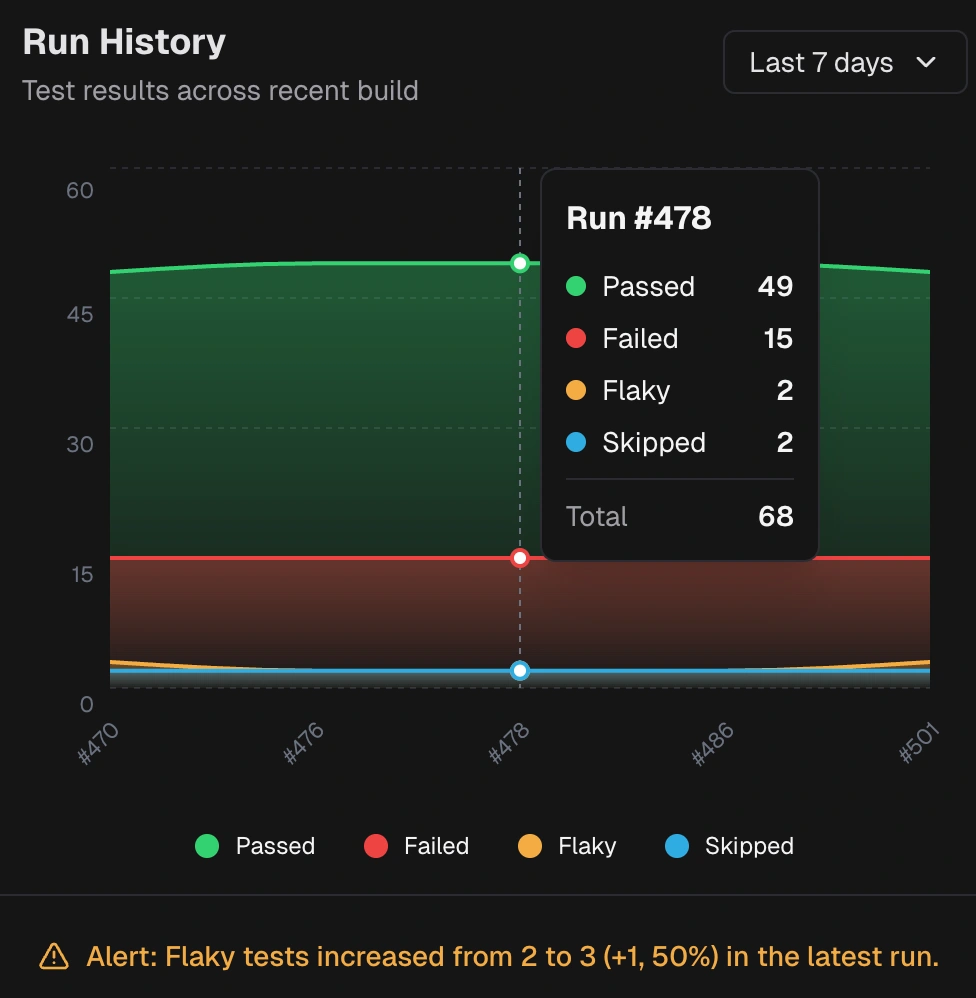 Shows counts of passed, failed, flaky, and skipped tests over the selected period. Uses the branch from the selected run. Highlights large changes in flaky share compared to the recent baseline.
Test Execution Time
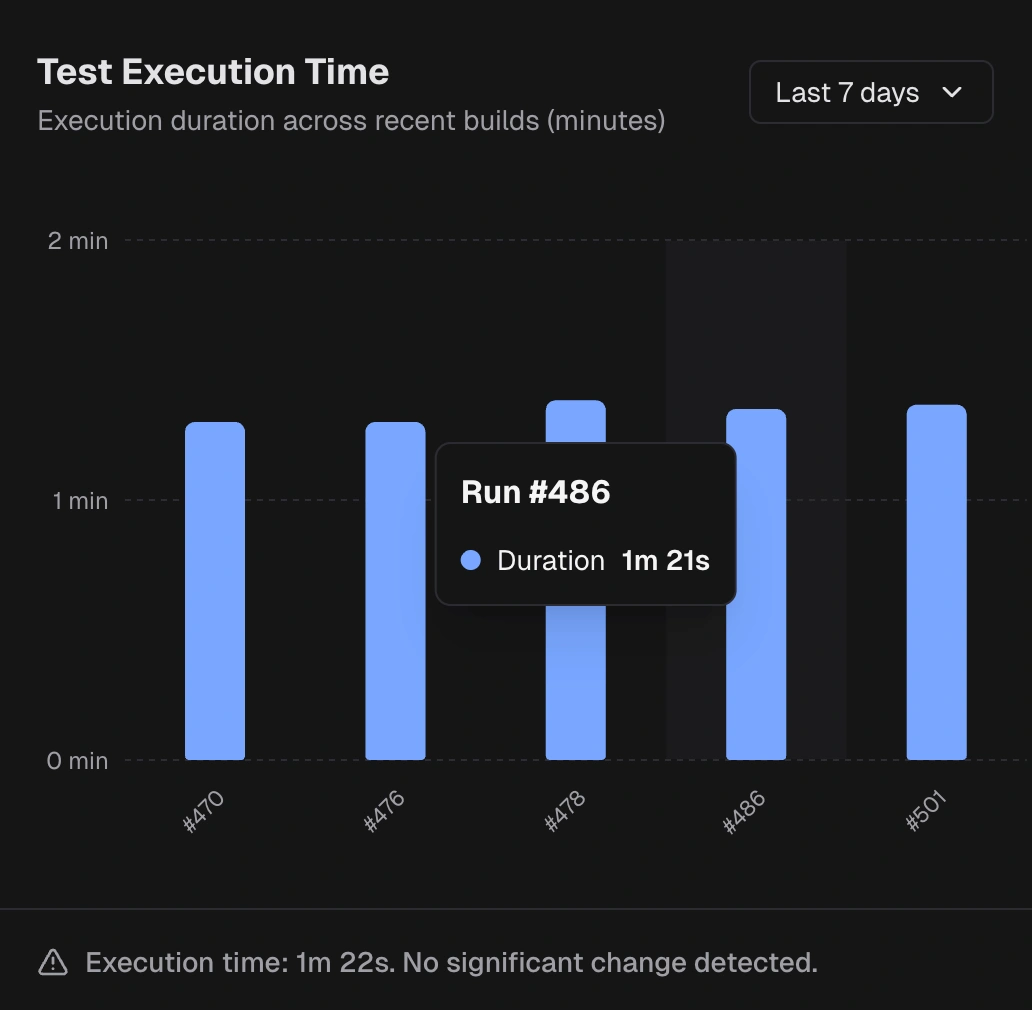 Shows total runtime per run. Highlights large changes compared to the recent average.