

Open a run
- Filter by time, environment, branch, status, or tags
- Scan result counts and open a run that needs action
- Use the detail tabs:
Search and filters
More filters holds the rest:
The Status dropdown has 2 sections, and you can select from either or both:
Use the Has tests that are section to find runs with a flaky or skipped test, which the run-level status does not surface on its own.
Active test runs
Runs still executing appear in Active Test Runs at the top, with a live progress bar and pass/fail/skip counts. Sharded runs show a SHARDED label and per-shard tabs. Runs assembled from separate CI jobs show a SPLITTED label, a progress bar segmented per split, and per-split tabs. Runs distributed across machines at runtime show a SWARM label, per-machine tabs, and the count of machines that have reported. Active runs also show their run-level tags and what started the run. A sharded run shows the tags from all of its shards.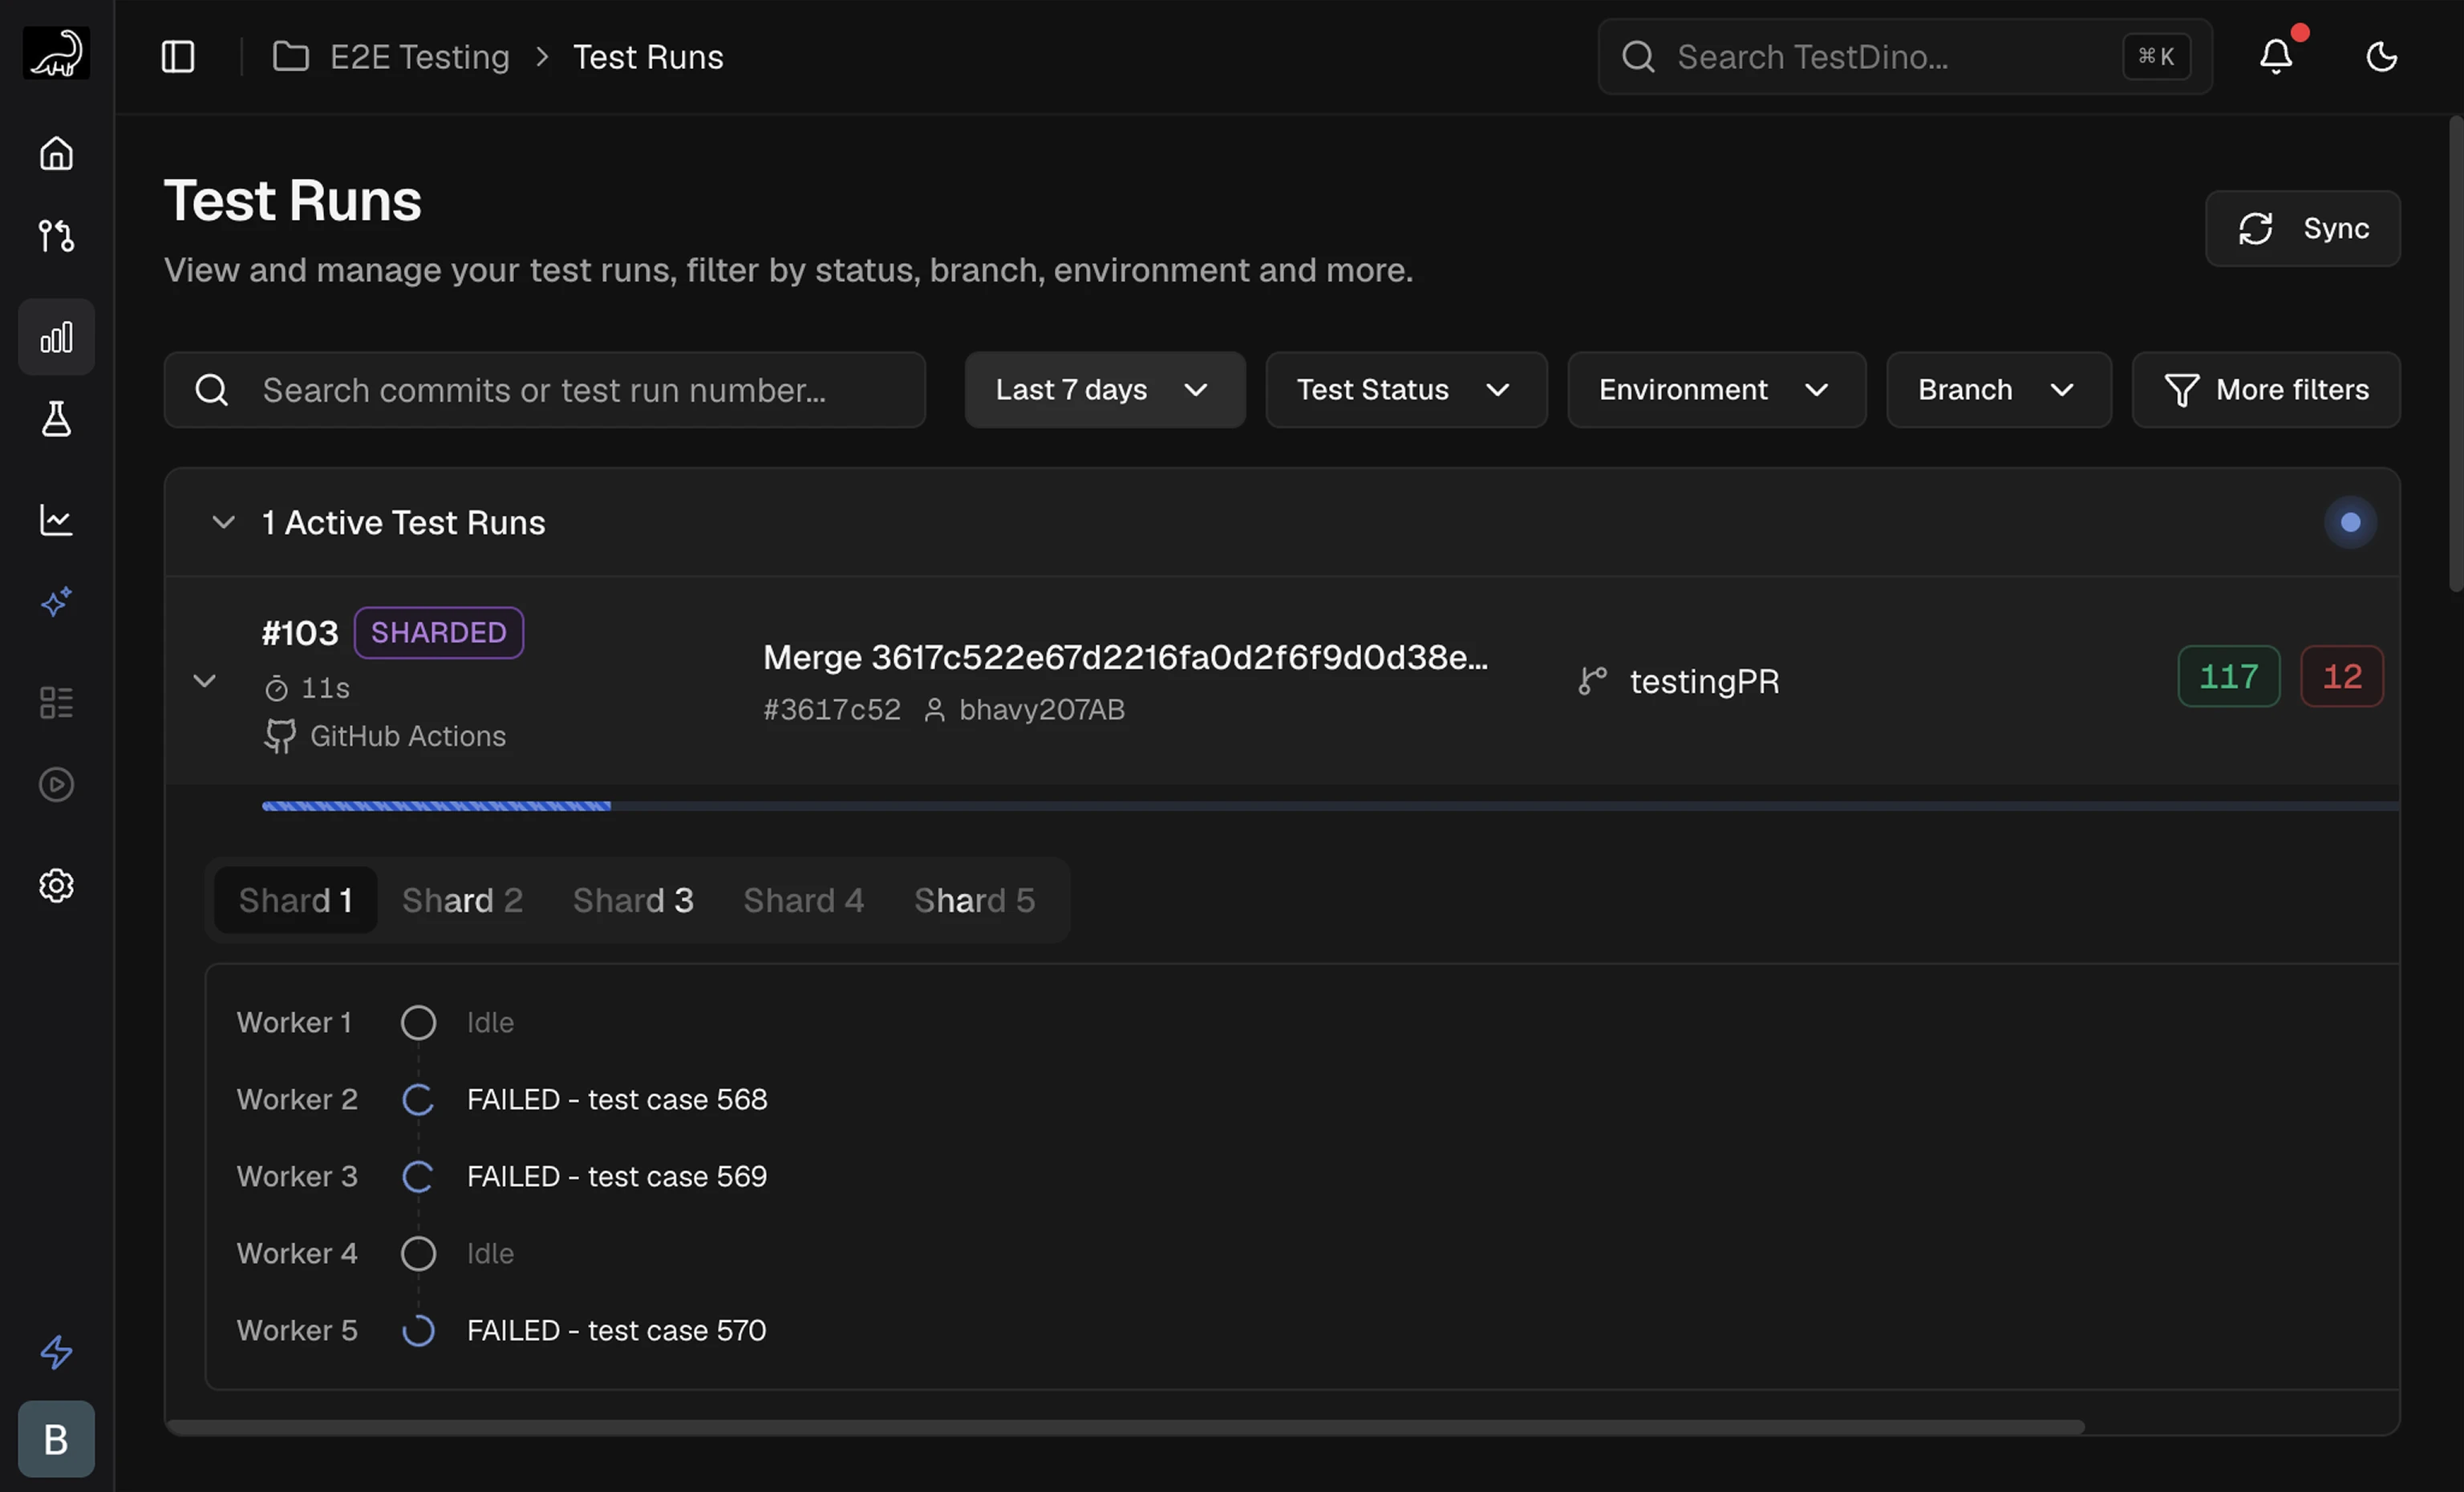
Run list columns
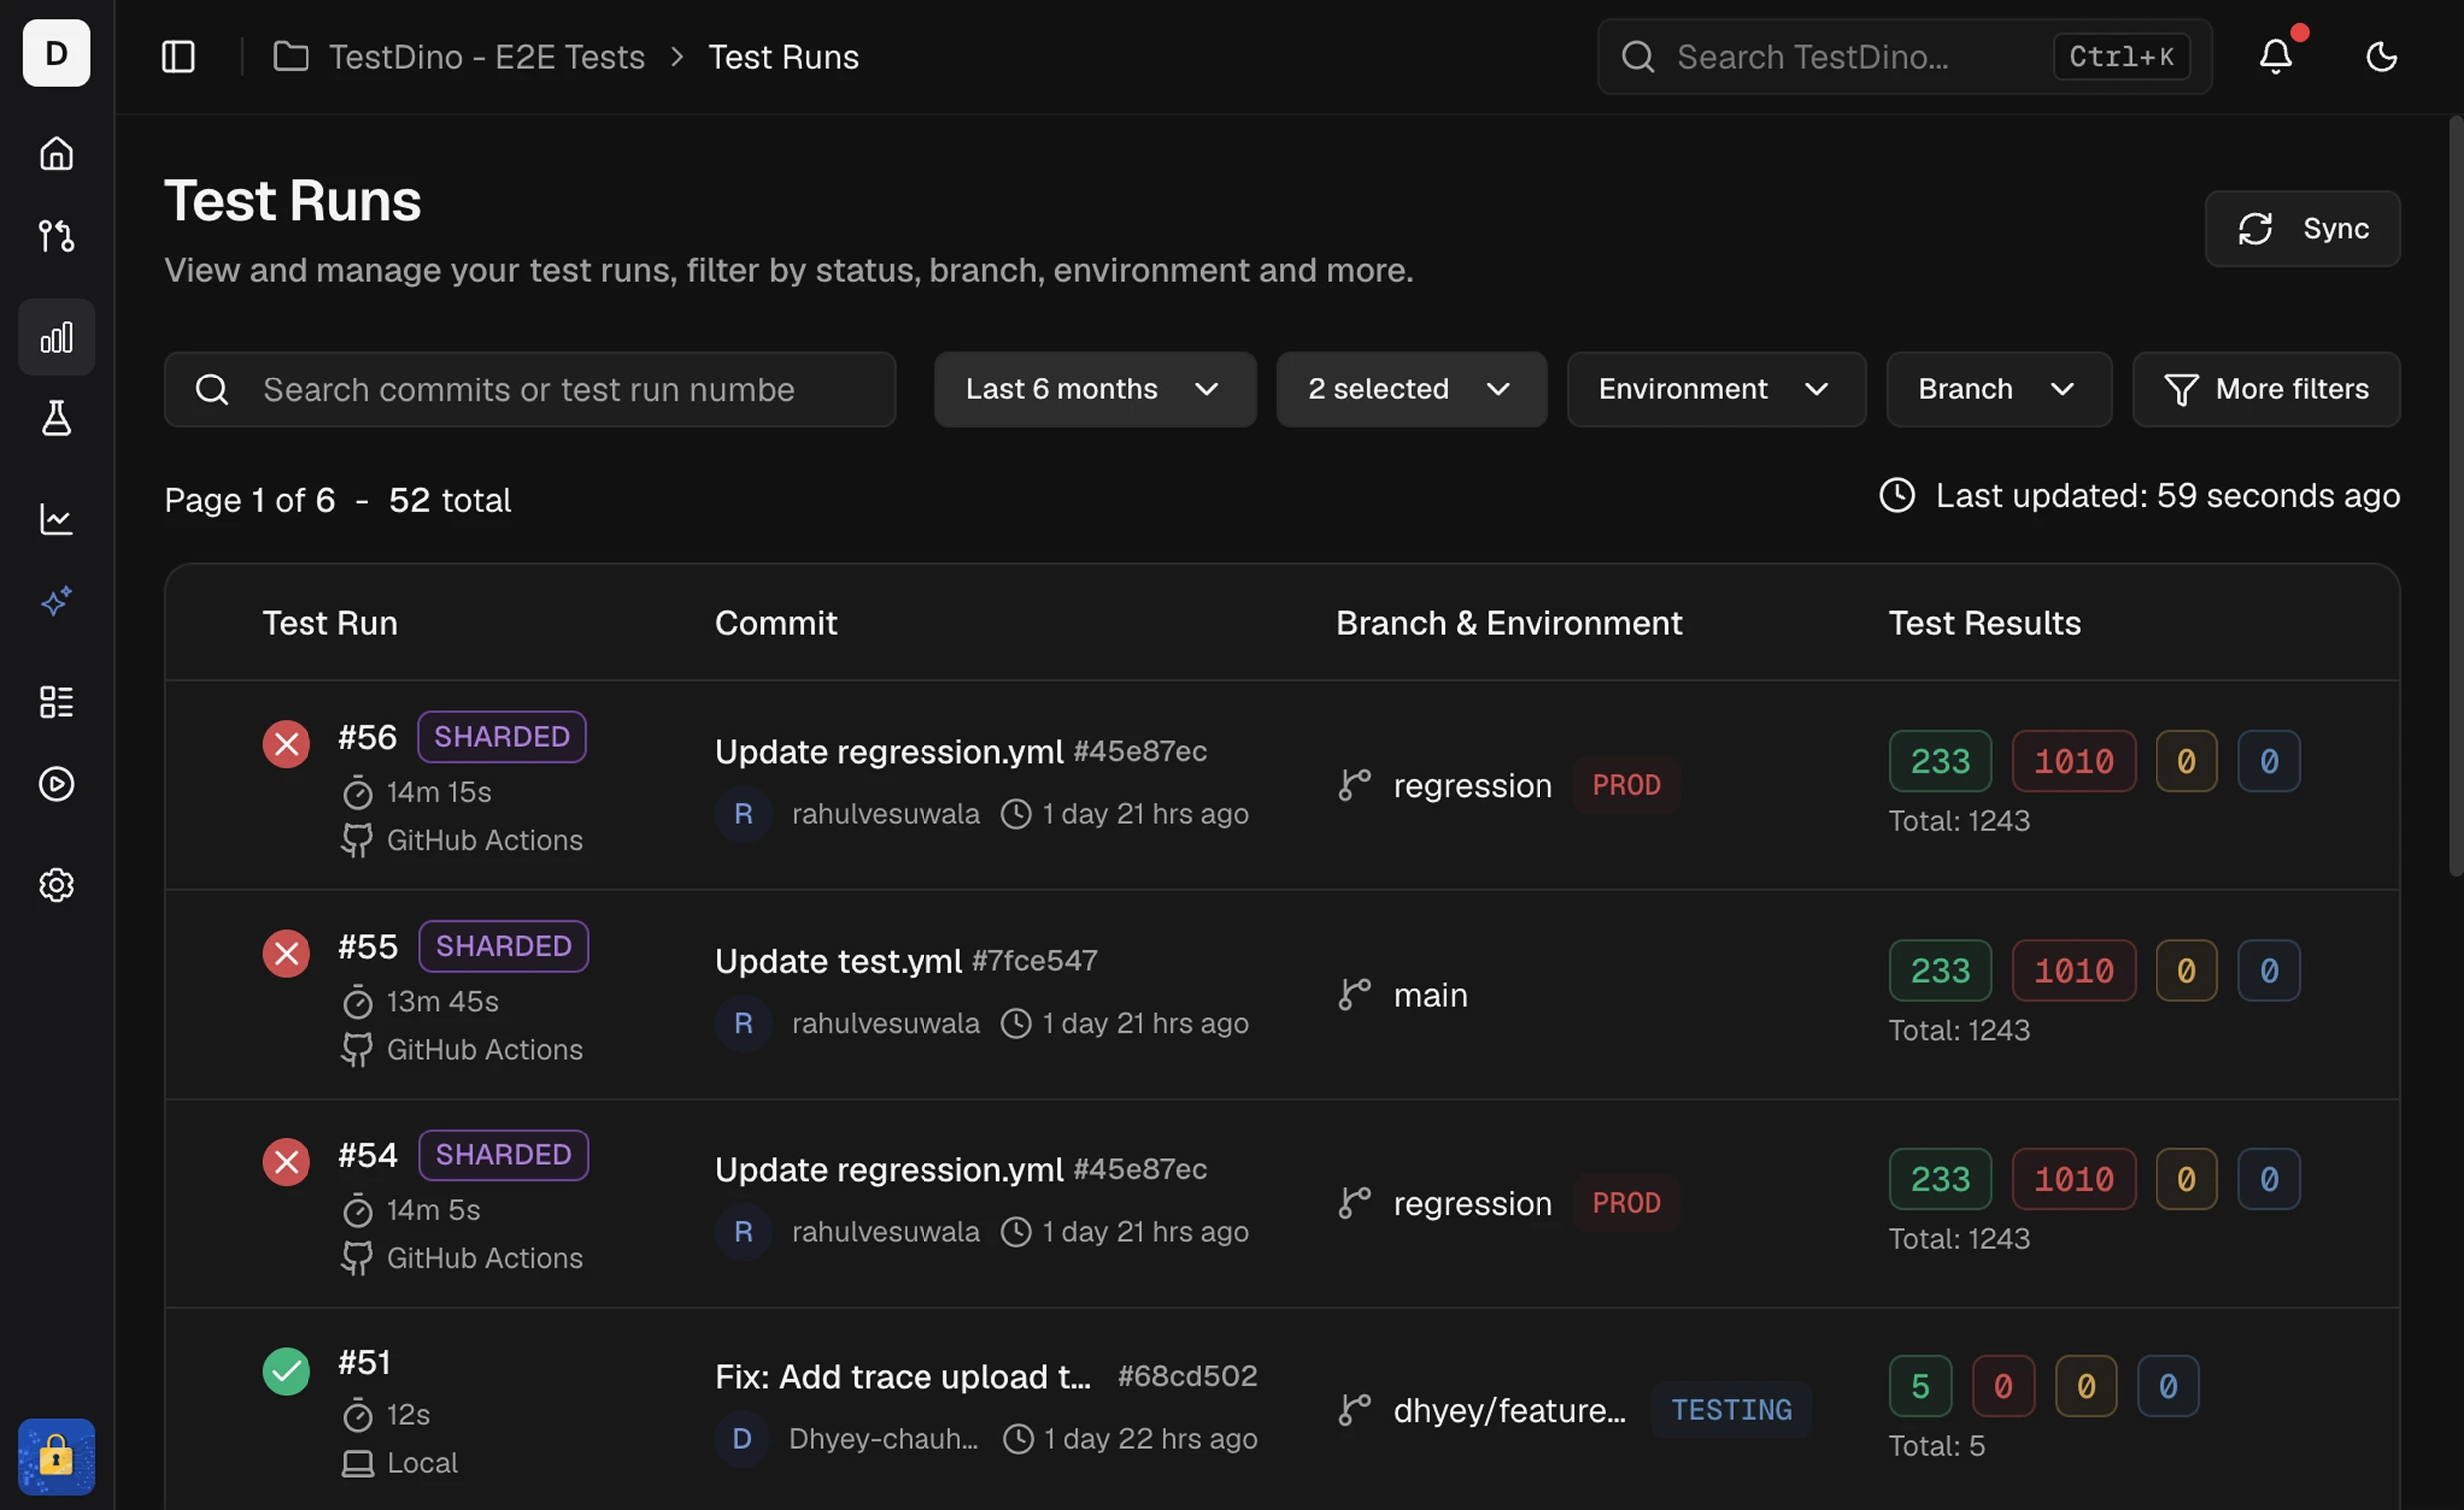
What started the run
The Commit column shows what started each test run. Hover the label for more detail.- On GitHub Actions, GitLab CI, Azure DevOps, and Buildkite, the label also shows who started the run. This needs
@testdino/playwright2.10.2 or later. - Re-runs started from TestDino show Re-run of #N in the Test Run column instead.
Run-level tags
Label an entire run with--tags on tdpw test. These are separate from test-case tags set via annotations.
Run detail header
Re-runs
A test run that has been re-run shows a row under its header with its latest re-run: the run number colored by status, the test case counts, the total, and when it started. With more than 1 re-run, View all N opens a table of them with Run, Results, Total, and Started columns, newest first. The table holds the 20 most recent and says so when there are more. A re-run inside the original GitHub run is labeled with its GitHub attempt, such asAttempt 2. When its retried jobs report as separate test runs, each carries the same label with the job count, such as Attempt 2 · 3 jobs.
A re-run is left out of run-level figures: test run count, pass rate, and average duration. Its test cases still count in test-level views, and it is billed like any test run.
Learn how to start one in Re-run failed Playwright tests.
Shards breakdown
Sharded runs (--shard) show a Shards section on Summary. Pass the same --ci-run-id to every shard so TestDino merges them into one run. Setup: Node.js CLI → Sharded runs.
After the run finishes, imbalance (for example
3.0×) compares slowest to fastest shard. A failure-concentration note appears when one shard holds most failures. Click shard rows to filter Detailed Analysis to those shards.
Splits breakdown
Runs assembled from separate CI jobs (--split) carry a SPLITTED badge and show a Splits section on Summary in place of Shards. Learn how to set the jobs up in Split mode.
A split that used
--shard expands to a per-shard table, and Split and Shard act as independent filters. If 2 splits reported the same test cases, the panel warns that per-split counts may be unreliable: split statuses stay accurate while totals become approximate.
When a split or shard fails before its first test, for example in global setup, the test run is marked Incomplete and Summary opens with This run is incomplete, naming each part that stopped and its error. In the Splits section, that split shows Did not start, and its tests are not counted in the results.
Machines breakdown
Runs distributed across machines at runtime (tdpw swarm) carry a SWARM badge and show a Machines section on Summary. Learn how to set the machines up in Swarm mode.
A headline above the table names what happened, for example
Split across 4 machines. runner-3 finished 45s early. While the run is in progress it reads Running across 4 machines. and counts the machines that have reported, not the machines you asked for. On a finished run, an Imbalance badge compares the slowest machine with the fastest.
When no machine could run a spec file, the test run finalizes as Incomplete and the panel lists those specs under No machine could run. Those test cases produced no result at all, so an incomplete test run is a coverage gap rather than a failure.
Click machine rows to filter Detailed Analysis to those machines. Learn how to read the panel in Read the Machines panel.
Summary
Failures and flakiness by cause
Errors
Group failures by the error that caused them
Test Cases
Evidence and AI analysis per test